There was no shortage of terror and despair in the financial markets… It was all a bit reminiscent of the fable about the little boy who cried wolf. By the time one finally appeared, most people had lost their capacity to believe and be alarmed.
~ Louis Rukeyser
In this week’s Dirty Dozen [CHART PACK], we discuss the swing underway in the Narrative Pendulum, the increasing signs of short-term over-optimism contrasted with long-term bearishness, and then we get into the unusual performance spread between small and large caps, talk recession signals, and end with a look at uranium, plus more…
Q1 2023 hedge fund letters, conferences and more
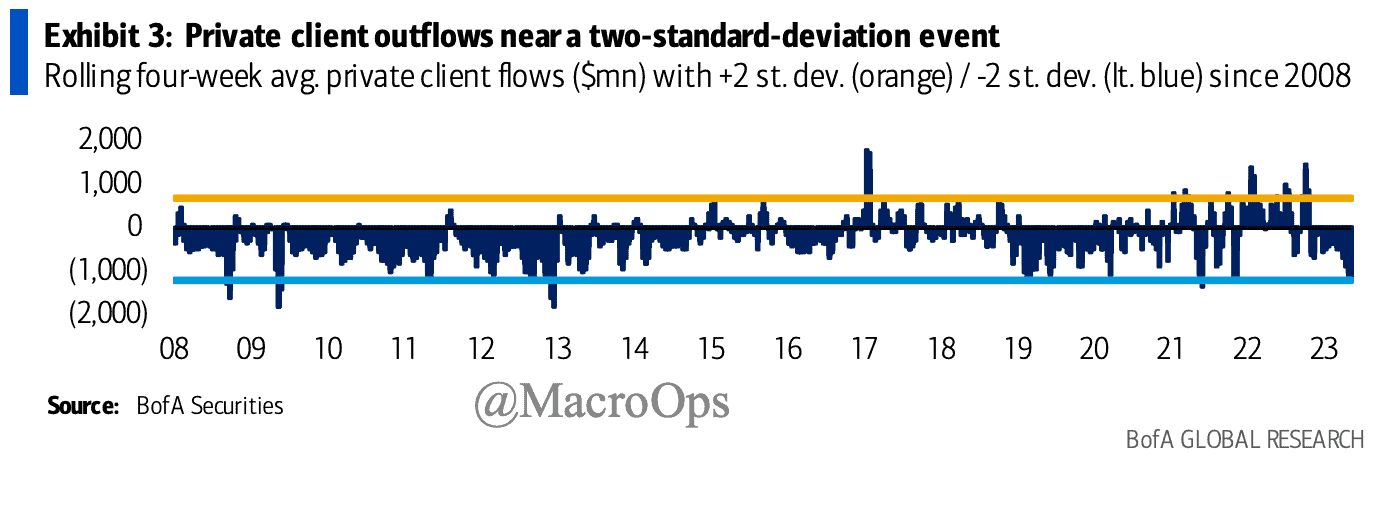
- “Rolling four-week average sales by private clients are the largest since Oct ‘21 and remain close to a two-standard deviation event — as we highlighted two weeks ago, the S&P 500 was historically up more than average over the next 1/3/6 months four of the last five times we saw similar retail capitulation of 2 standard deviation outflows” via BofA.
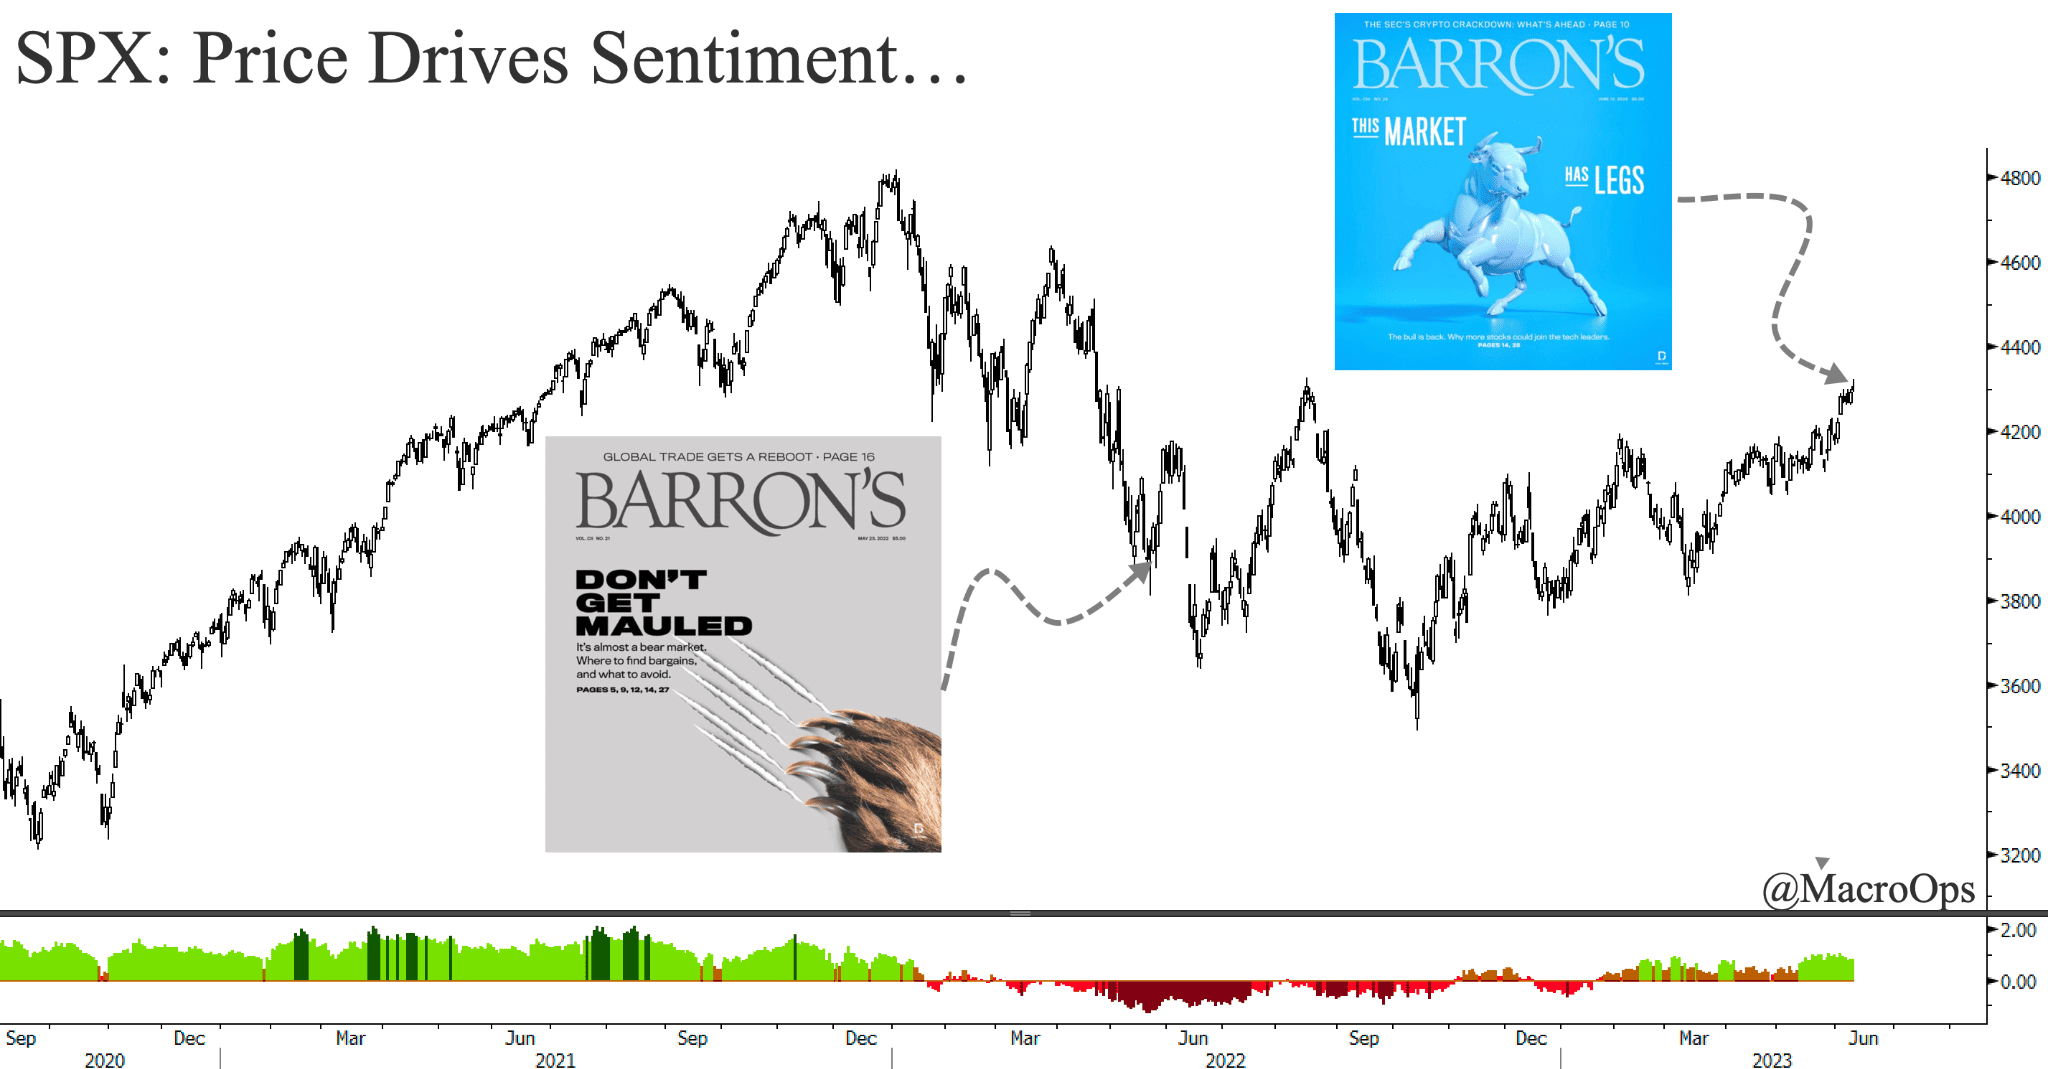
- There’s nothing like price to drive investor sentiment and set a new popular narrative. It’s taken some time but we’re starting to see the narrative pendulum swing from “Don’t Get Mauled…It’s almost a bear market…” to 11 months later “The Market Has Legs… The bull is back. Why more stocks could join the tech leaders.”
Magazine covers are never reason alone to be bullish or bearish… just some context for the sentiment shift underway.
- I was recently asked about my views regarding the current sentiment/positioning backdrop of the broader market. To answer this question I always start with the same set of quantitative data points so as to make sure my personal bias doesn’t color too much of my read.
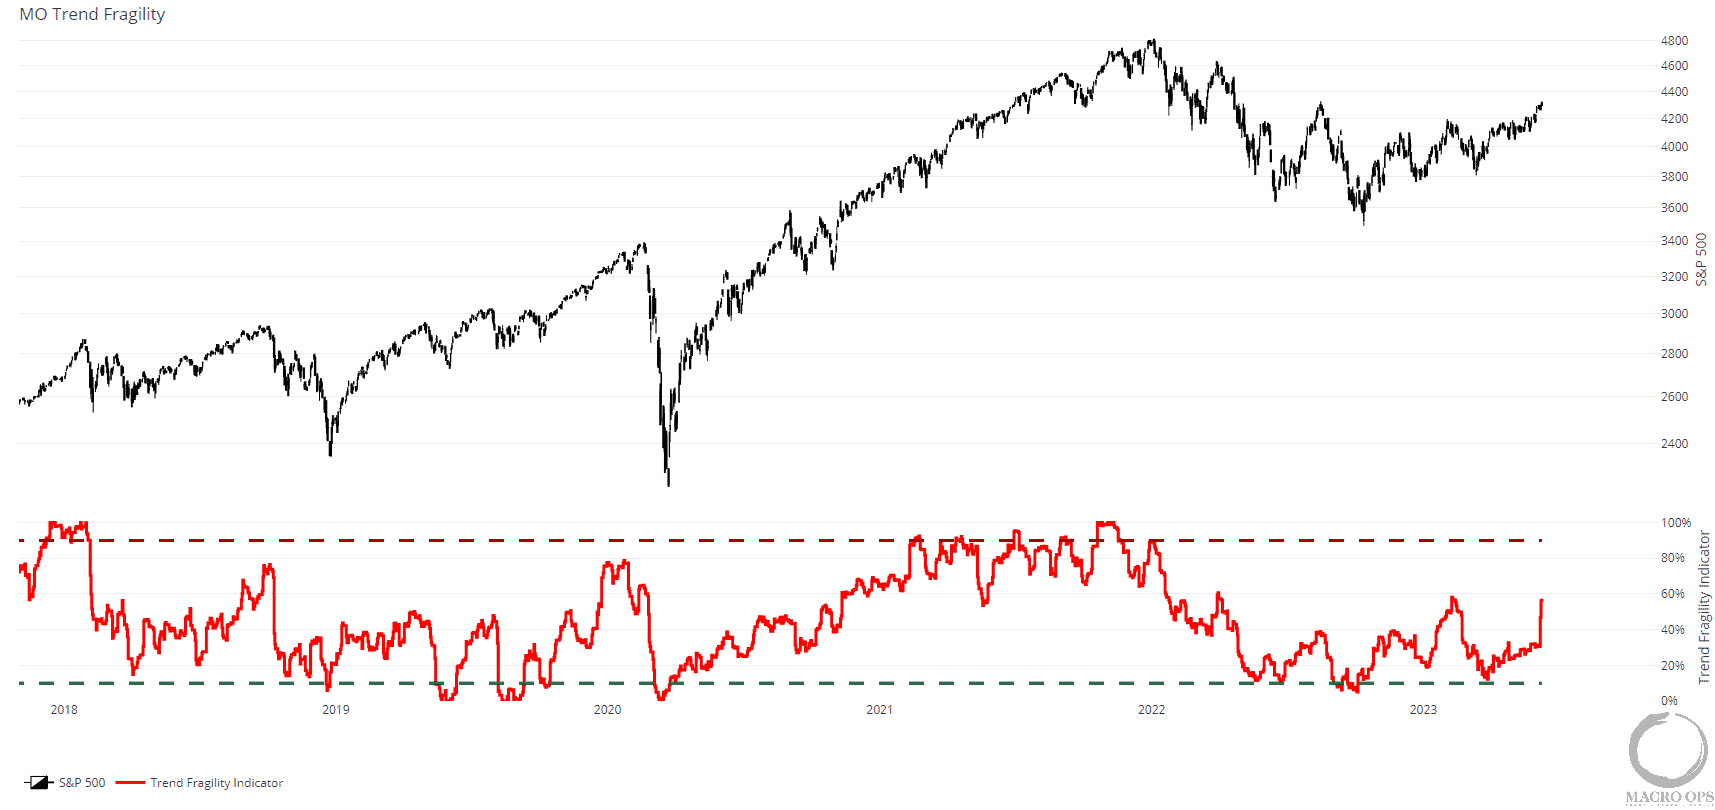
In this case, the data I first turn to is our Trend Fragility (TF) indicator, which is a composite measure of sentiment, positioning, and flows.
The TF recently jumped up a good deal but remains well below levels which marks a major sell signal. How quickly we get to a sell signal being triggered is partly path dependent and investors’ reaction function to that path (ie, are they quick to buy the dip going forward or does sentiment/narrative quickly turn sour after a little selloff?).
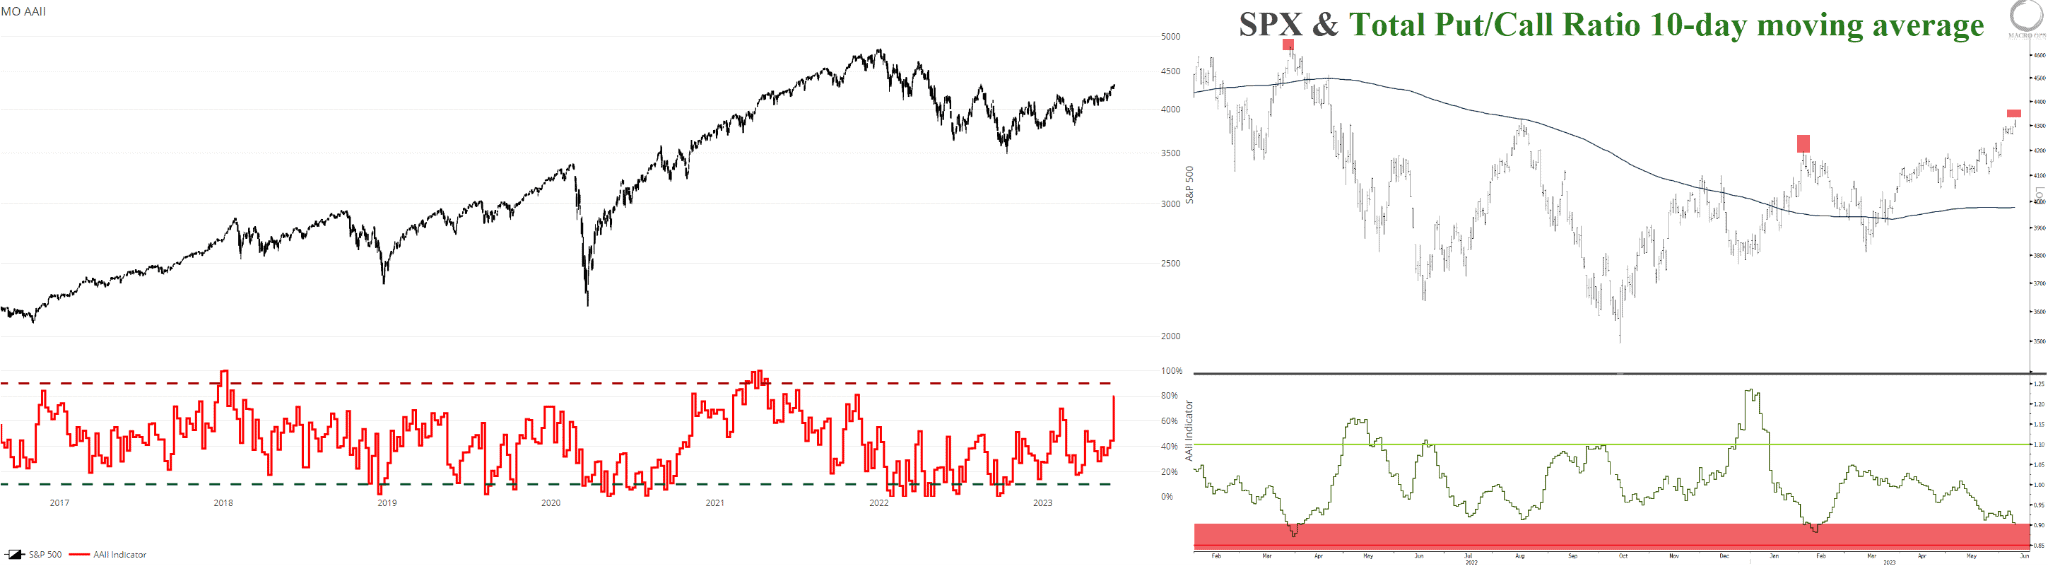
- Our shorter-term sentiment/positioning indicators are showing some signs of excessive bullishness though.
Net AAII Bull-Bears saw one of its largest weekly jumps and now sits at 80% while the Total Index Put/Call 10-day moving average has fallen to near 12-month lows, meaning investors are buying less downside protection versus betting on further upside. This level has coincided with pullbacks/consolidations over the past year.
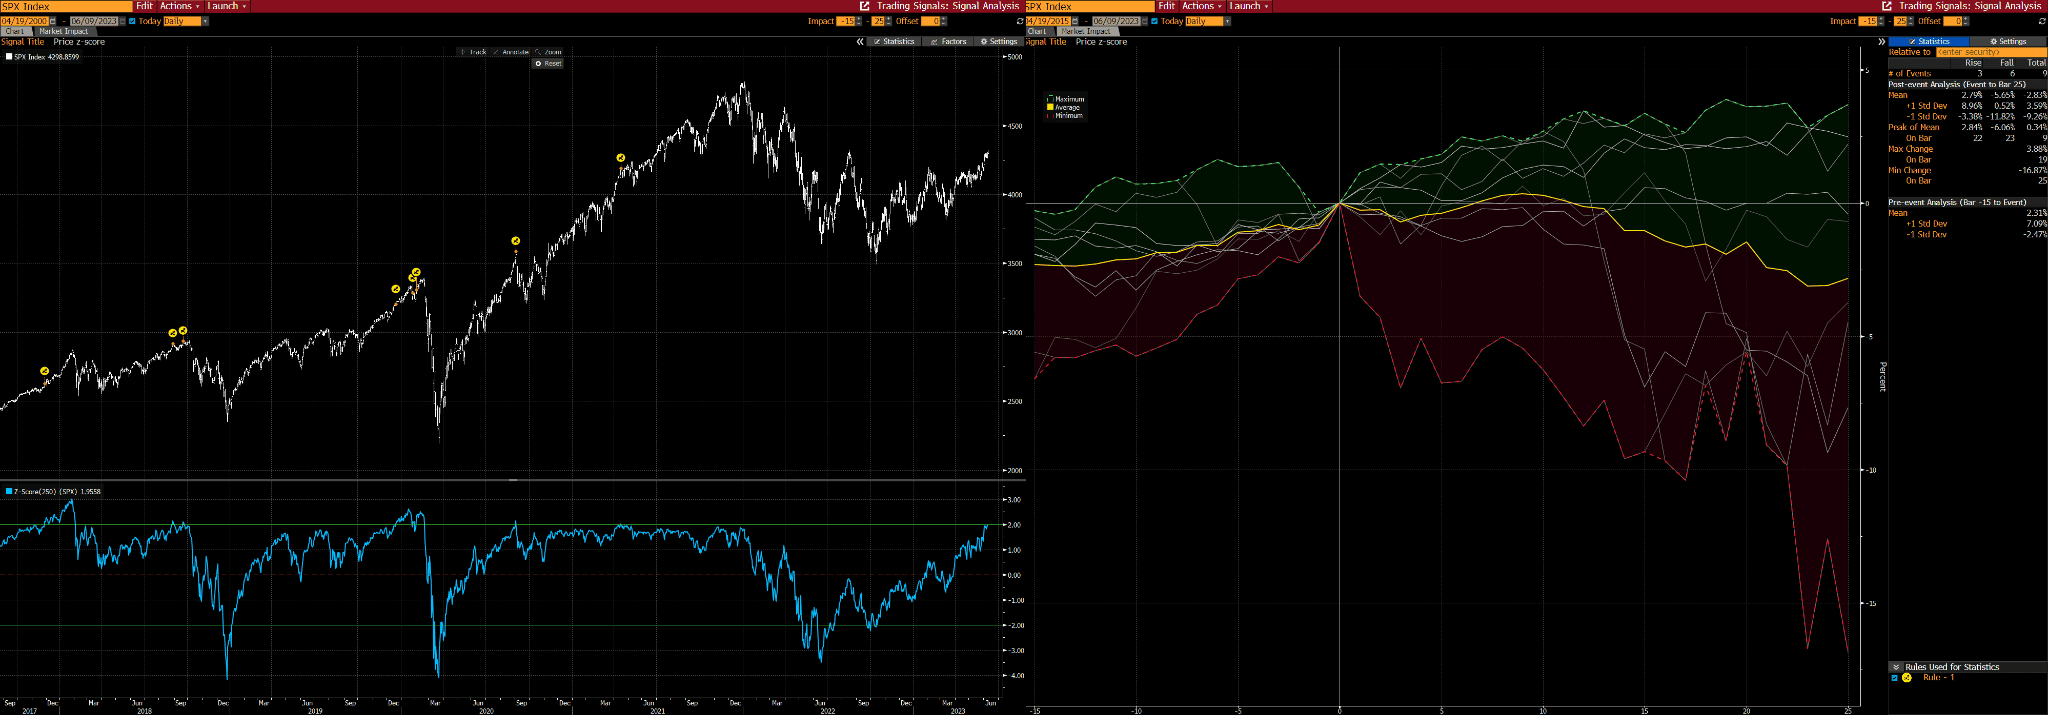
- In addition, we’re nearing overbought levels according to some measures. Here’s the straight 52w z-score of SPX’s price, which is near a 2std move. The yellow dots on the left chart mark all past 2std moves over the past 5yrs while the graph on the right shows the average 25-day returns.
- We got long the Russell 2K last week on the back of its breakout from its 10-week rectangle. Ideally, we’ll see a muted pullback / sideways range over the first couple of days this week before another leg up. A move back into the rectangle would nullify this trade.
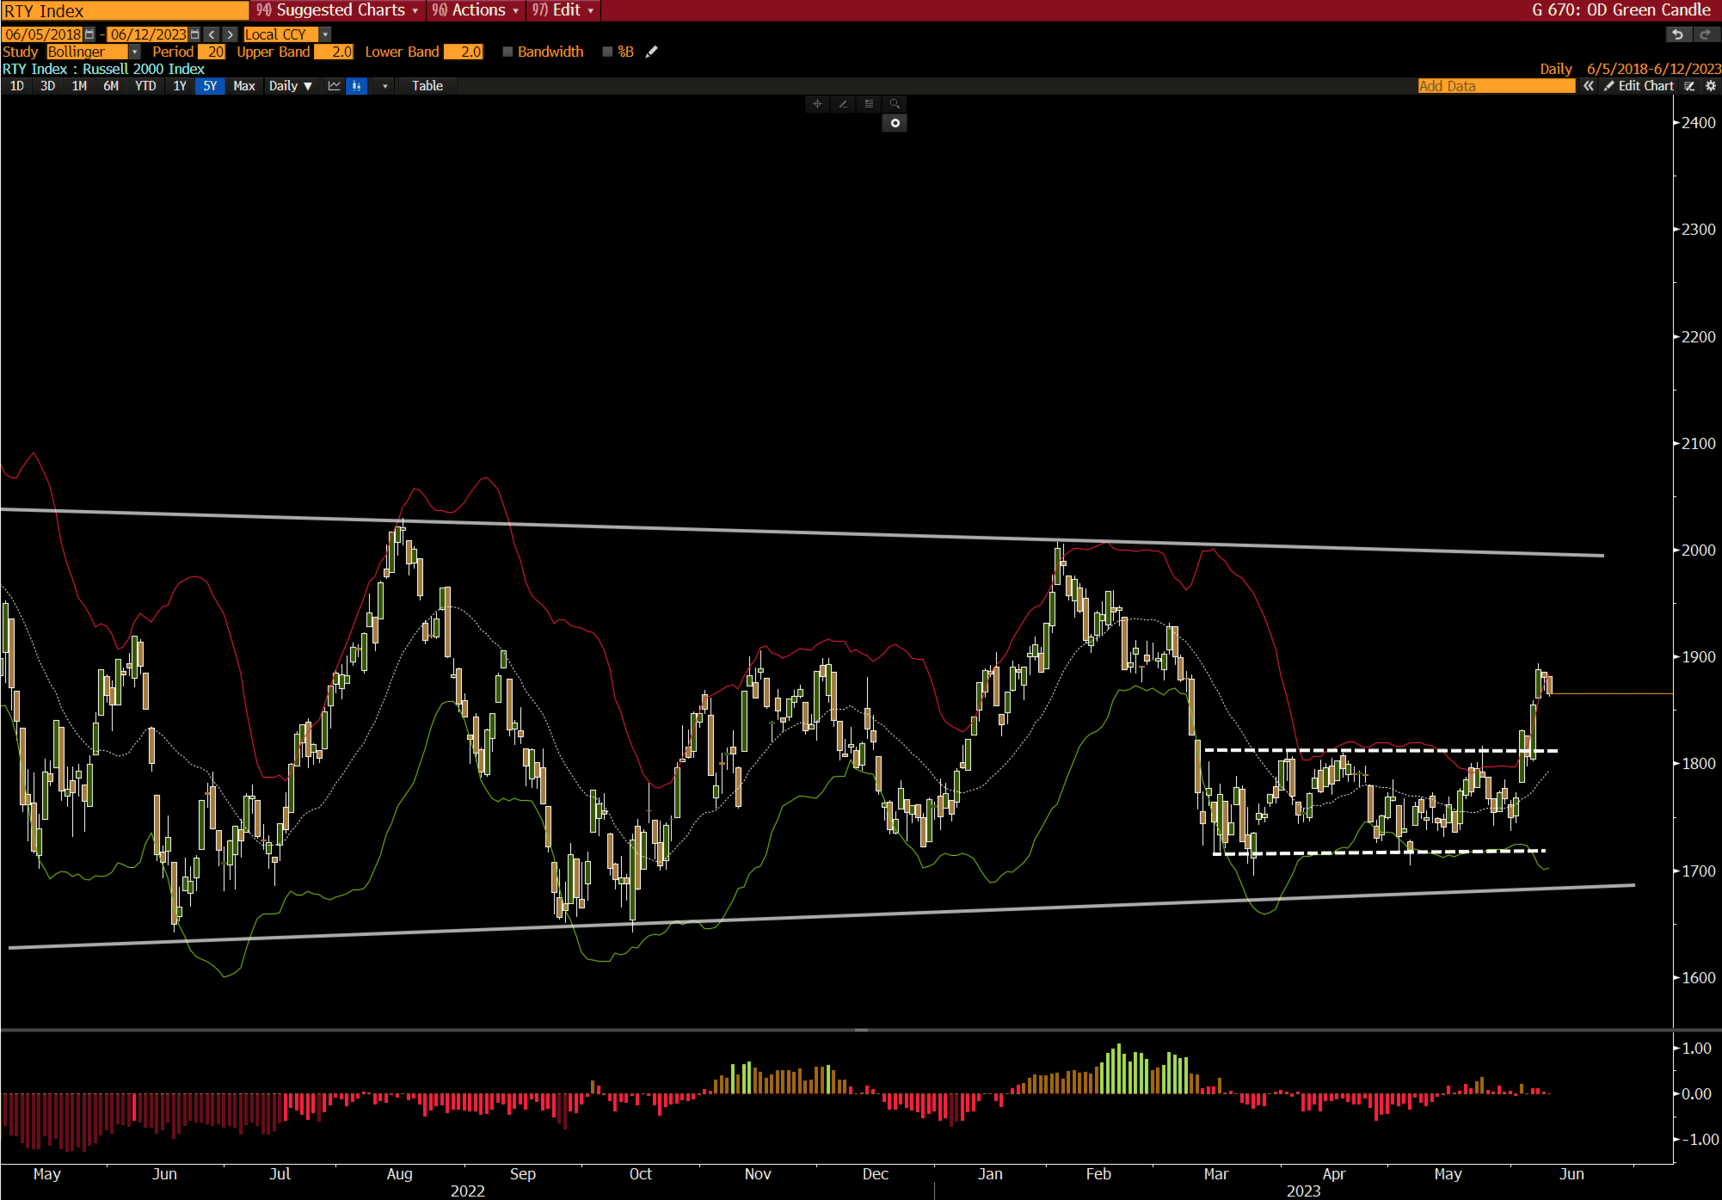
- We flipped out of our Nasdaq 100 longs and into Russell 2K the other week, as the former is overextended and overloved while the latter recently broke out of a tight consolidation level and is under-owned.
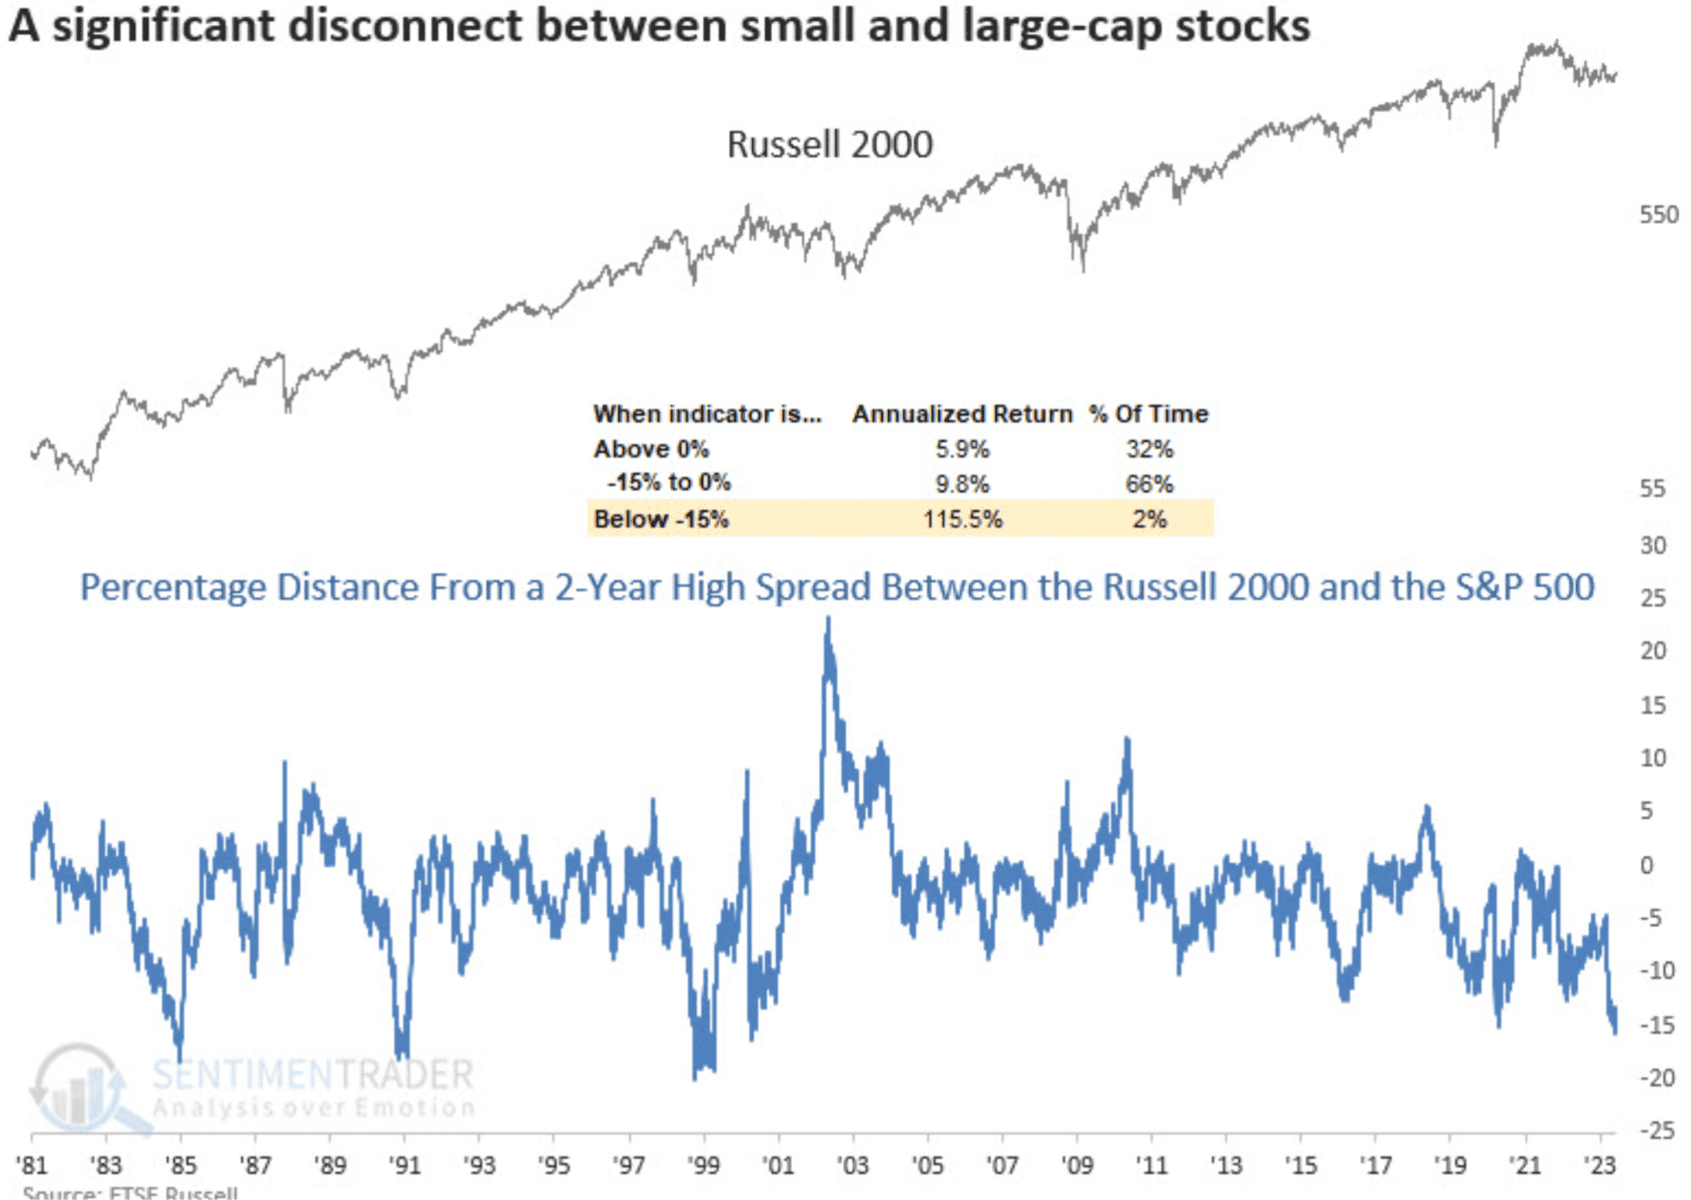
@DeanChristians shared an interesting stat last week highlighting the extreme disconnect between the two indices, writing “The disconnect between small and large-cap indexes is one of the most significant in history.
For only the 6th time in 40 years, the distance from a 2-year high spread between Russell 2000 and the S&P 500 widened to 15%.”
Small-caps have seen annualized returns of 115% following past instances of -15% or below performance spreads.
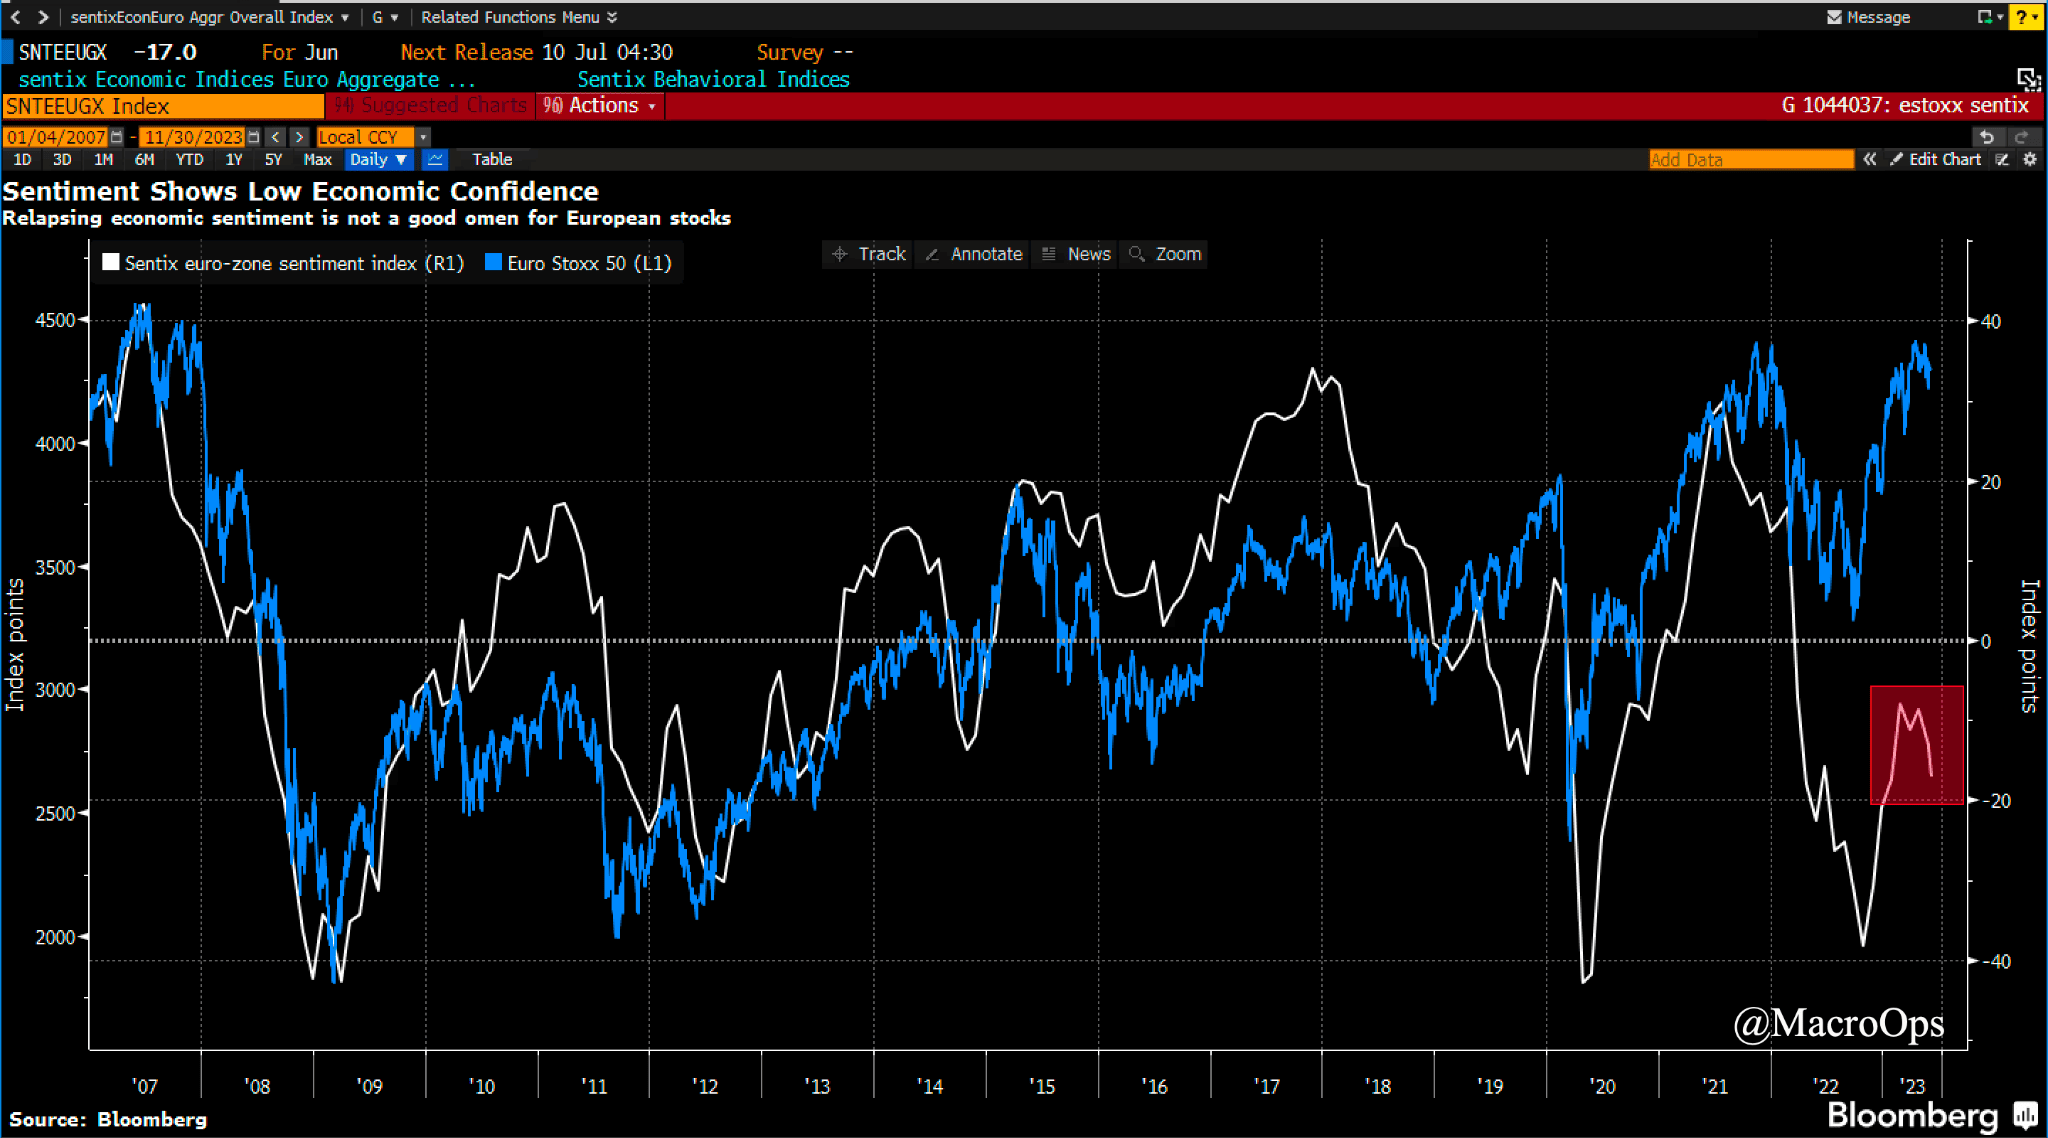
- The Sentix Eurozone Sentiment Index (white line) has turned widely negative, diverging from the Euro Stoxx 50 index (blue line), which it has shown a strong correlation with in the past.
I don’t see a trade here yet but I’m watching the chart closely for a short setup to develop.
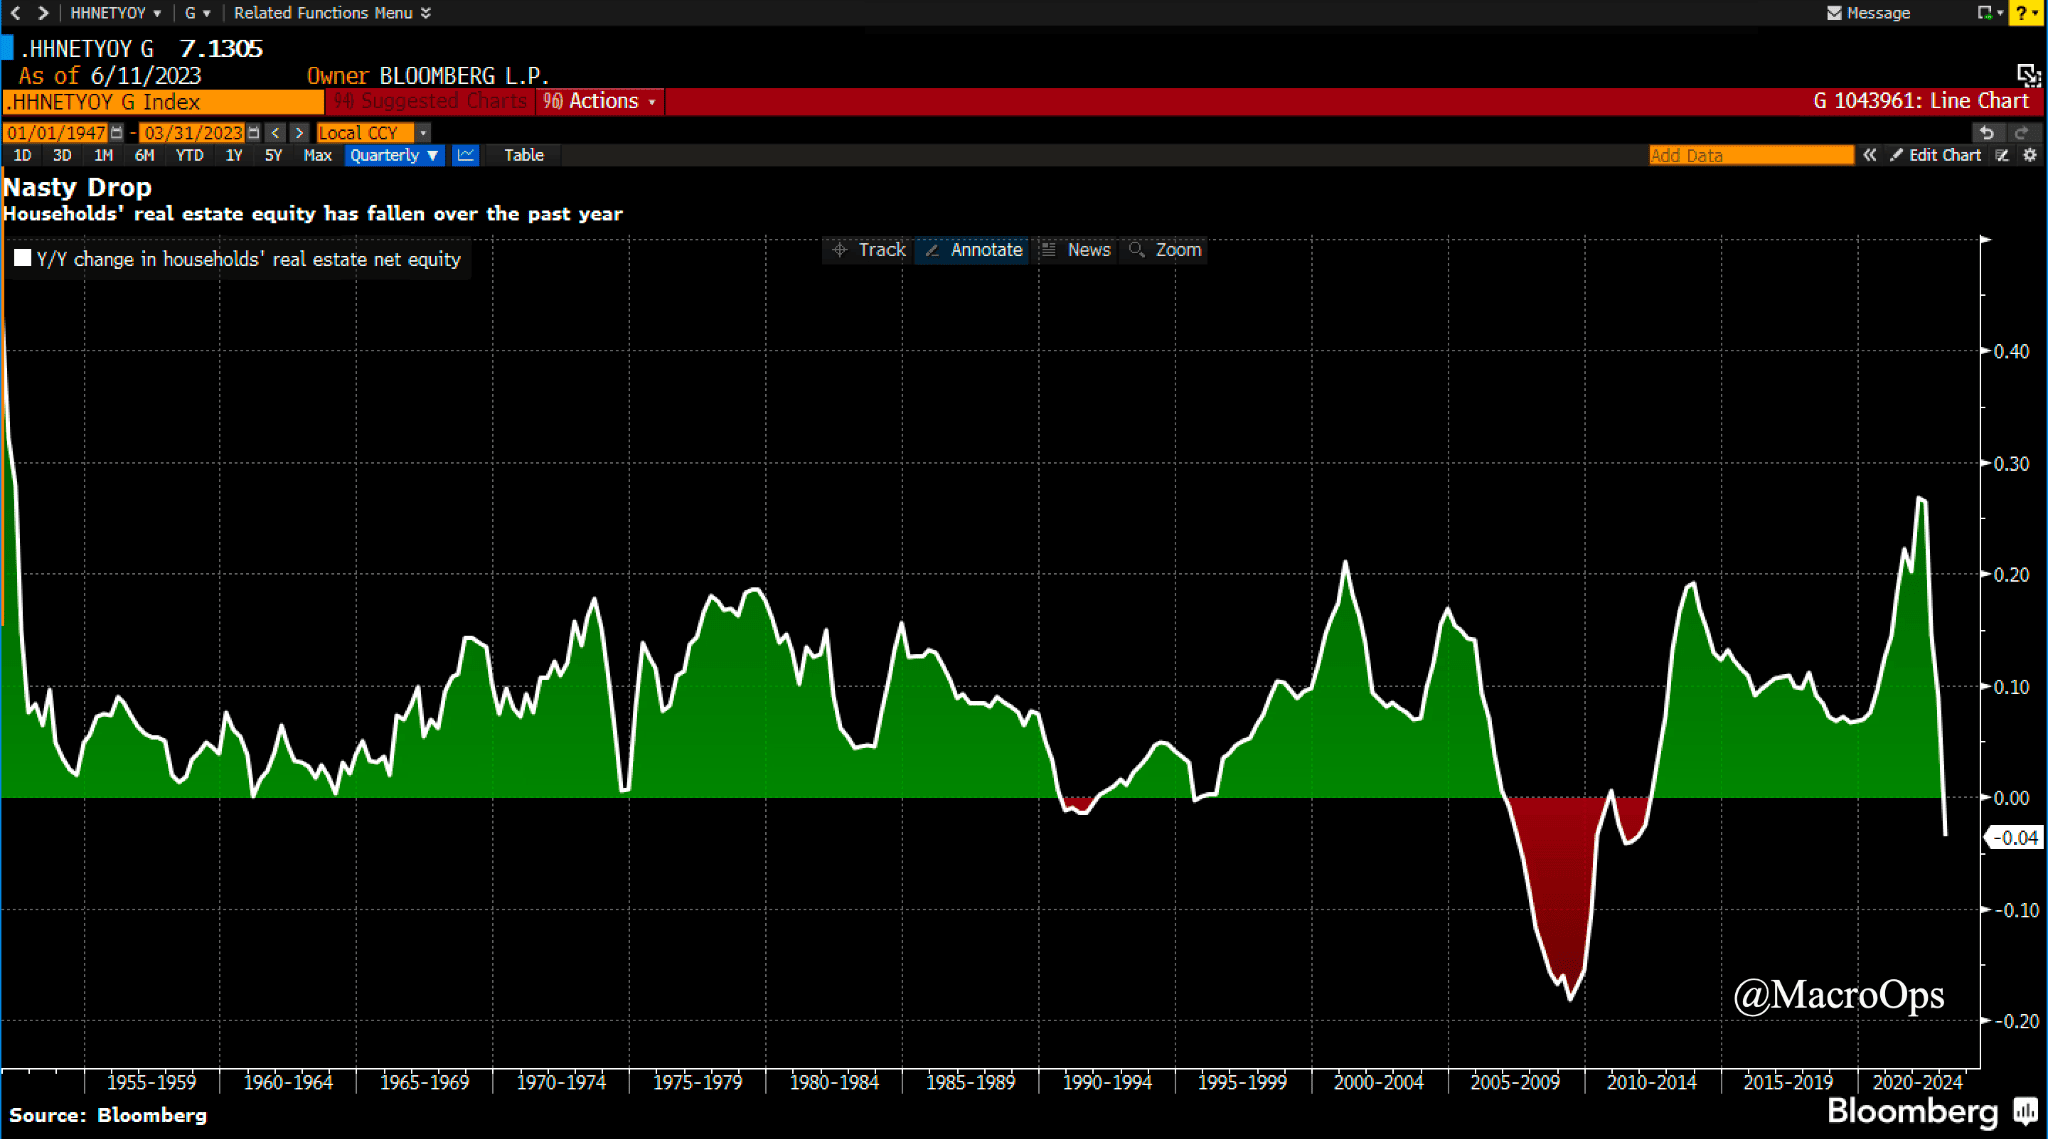
- Cameron Crise of BBG recently pointed out that real estate equity has turned negative on a YoY basis for only the third time since the 1950s. Crise writes “The magnitude has been exceeded only by the drop during the GFC and its aftermath. That’s obviously not great news, and isn’t exactly a platform for ongoing spending in the face of households’ real-income headwinds.”
We can add this to the growing list of demand and liquidity headwinds with the upcoming TGA refill, the expected depletion of excess consumer savings by September, and the resumption of student-loan payments around the same time due to the recent debt ceiling negotiations.
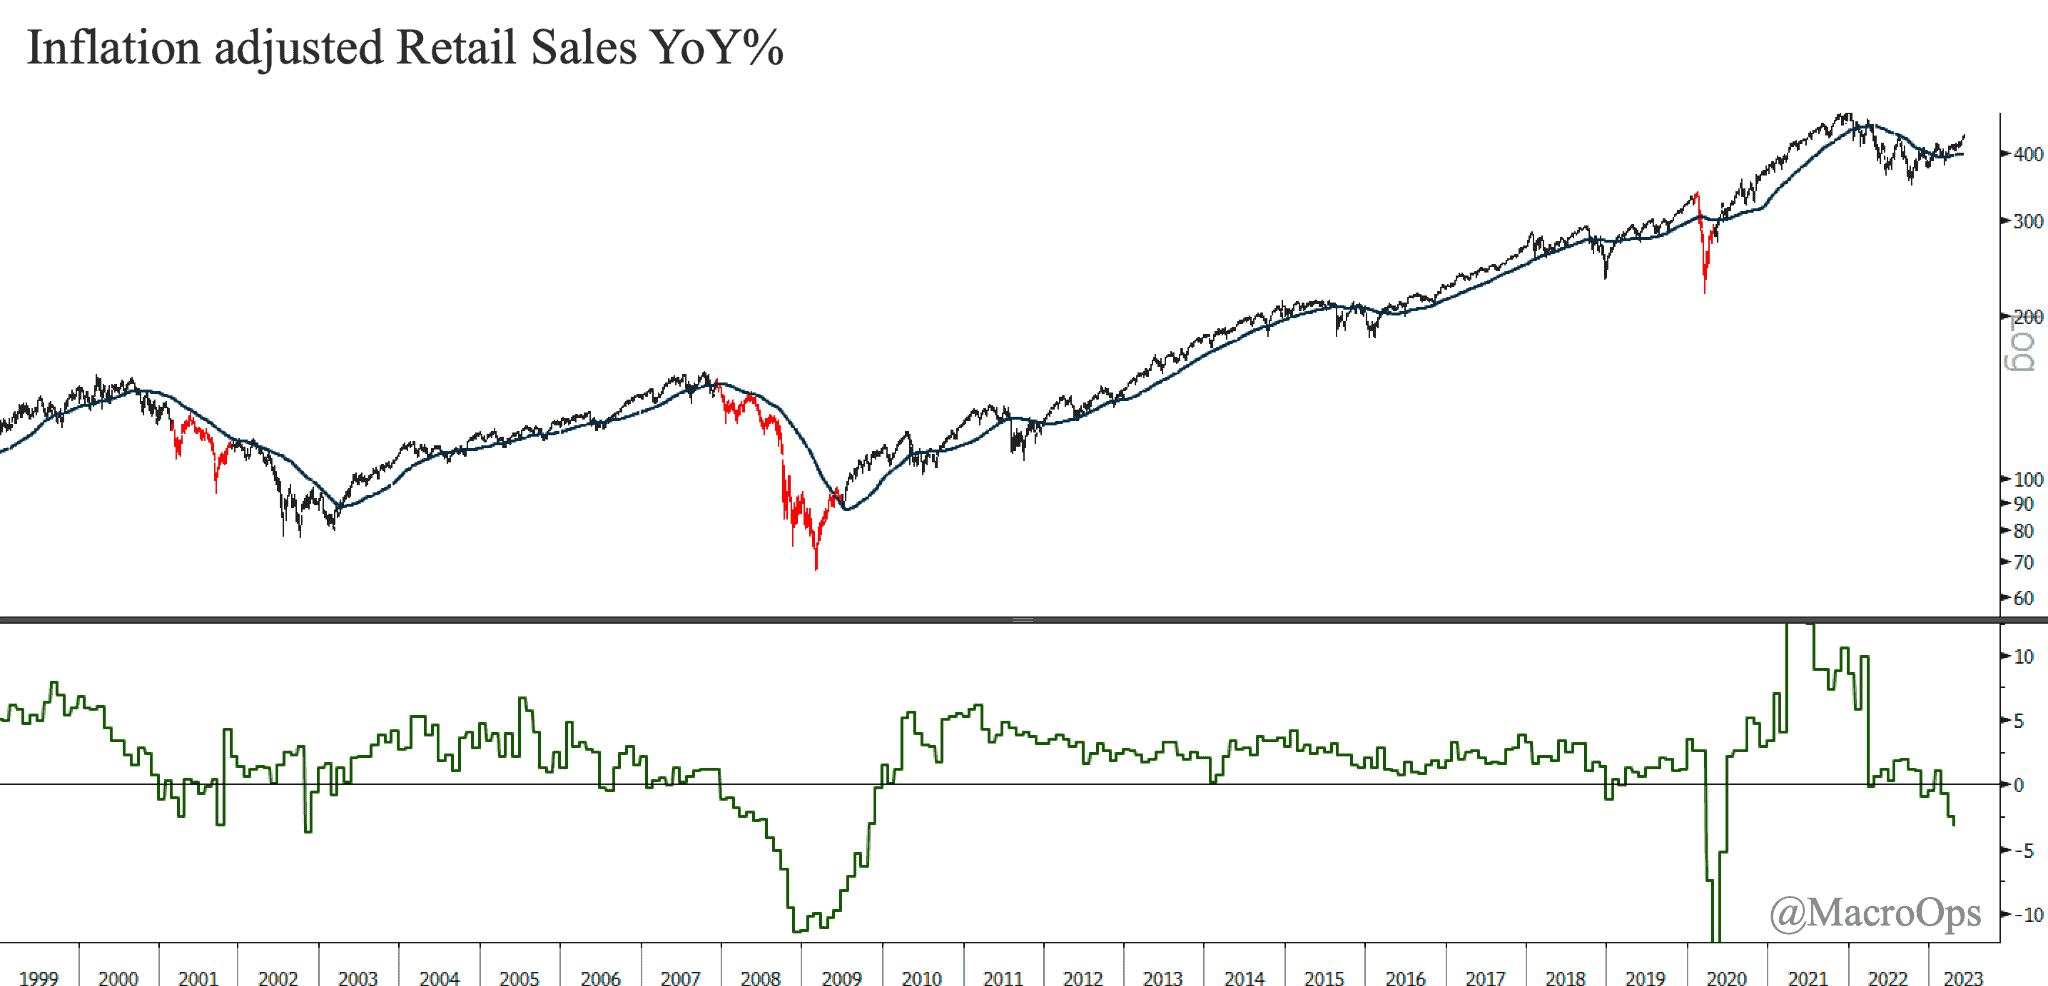
- We’ve been in the late 23’ (Q3/Q4) recession camp since the middle of last year. Our reasoning behind the call isn’t rocket science. We simply have a process that follows a number of time-tested reliable recession indicators. And when a certain number of them flip red, we begin working off the assumption that a recession is inbound within a certain timeframe.
One of these indicators is real retail sales YoY%, which is at -2.5% and trending lower.
With that said, traders and investors over-anchor/over-focus on economic data points as well as the recession question, and they do so to their own detriment. Instead, they should be flexible yet logical with their macro views. They should prioritize price action then sentiment/positioning and then finally, macro in their analysis funnel. Doing so helps keep you from swimming against the currents too much.
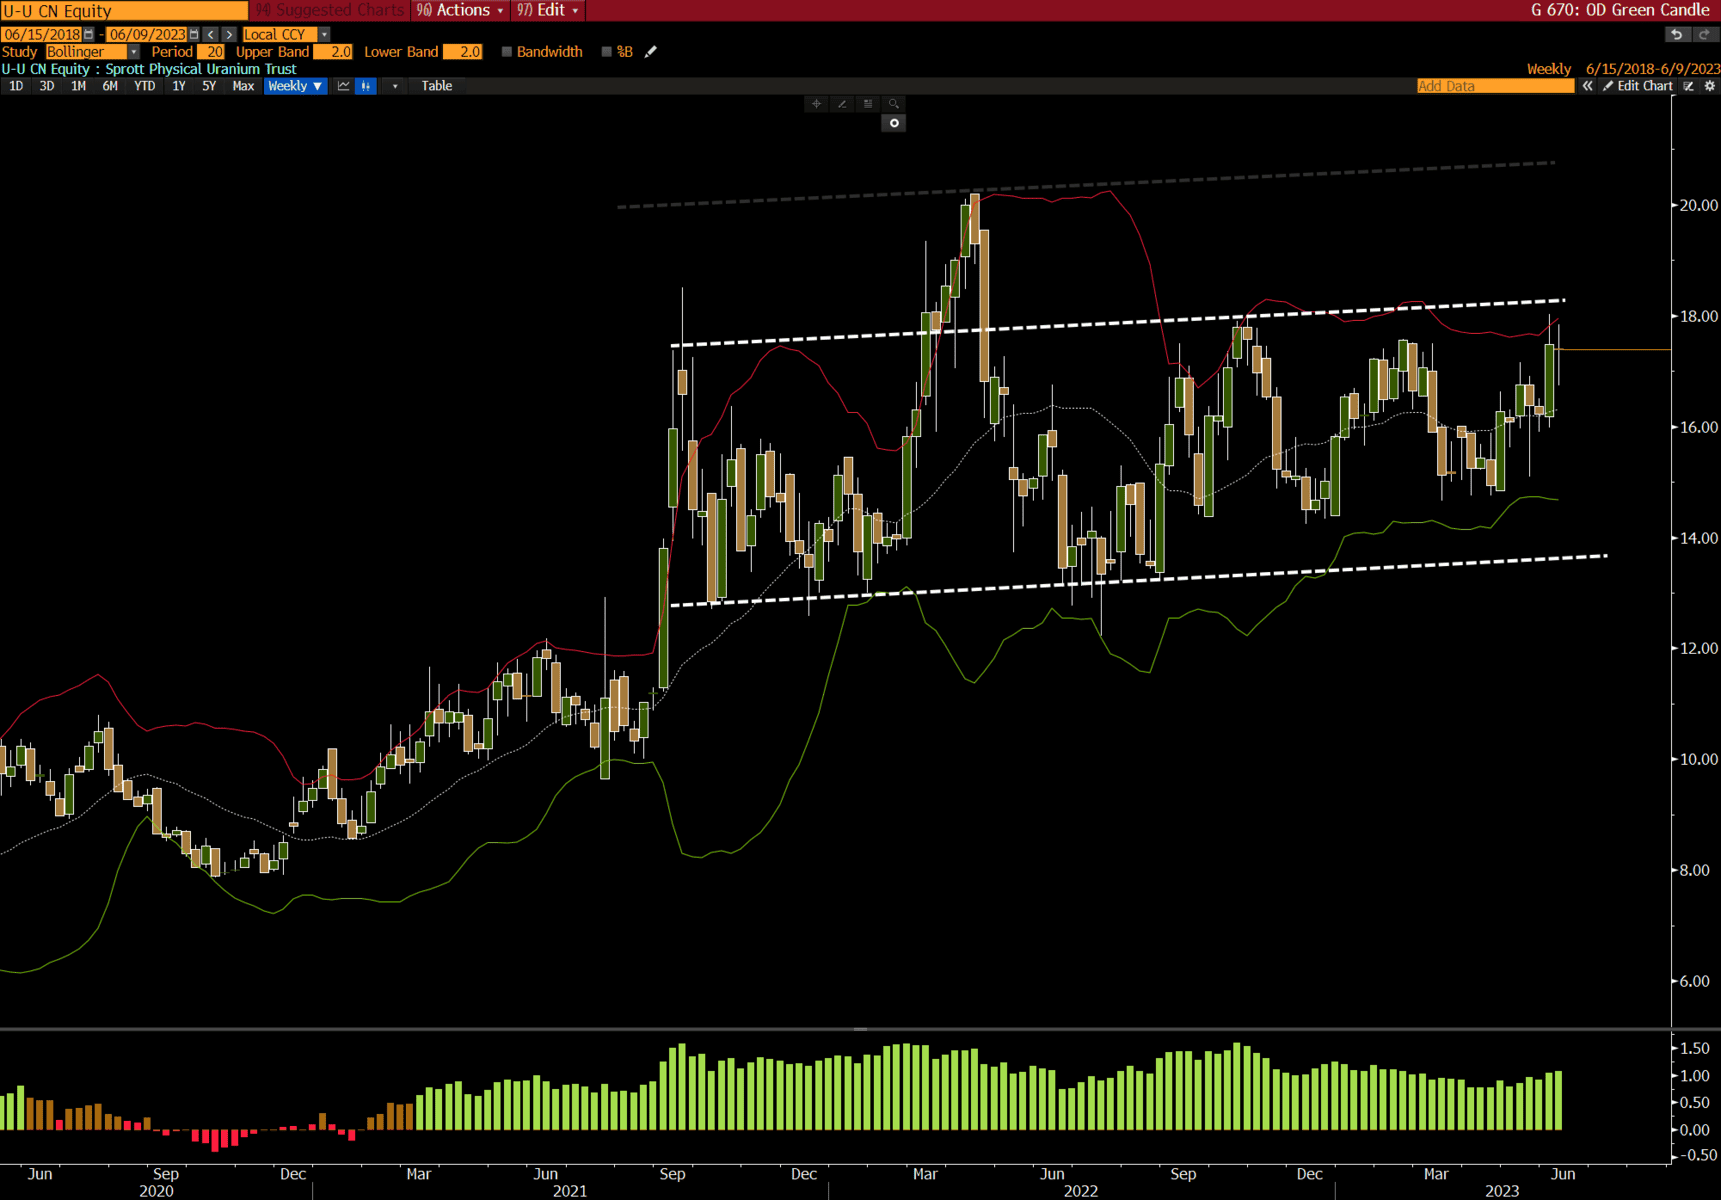
- Spot uranium prices are trending higher and are now at their highest prices in over a year.
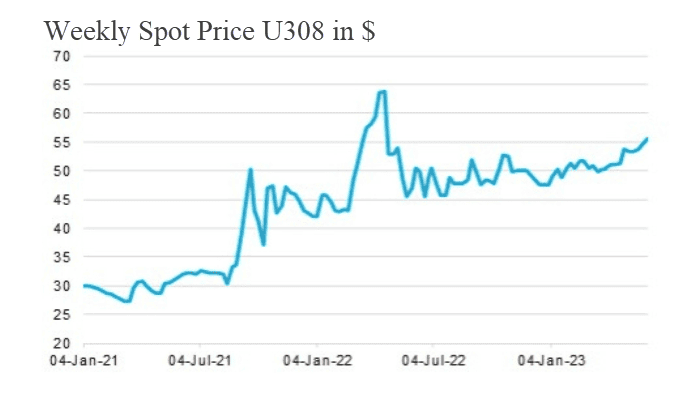
- The Sprott Physical Uranium Trust (U-UN:TSX) is near the upper range of its 18-month+ consolidation zone. We’re long and will be adding on a breakout.