
Welcome to RIA Pro
Within the next few weeks Real Investment Advice will officially introduce and launch RIA Pro. This new subscription service will offer investors an indispensable set of proprietary research tools and commentary aimed exclusively at helping those who wisely seek to compound their wealth.
[timeless]
Q1 hedge fund letters, conference, scoops etc
Preliminary to the formal launch of this new service, and to give interested readers a sense of what is to come, we are providing you the following RIA Pro Fixed-Income Chart Book. Bonds play a vital role in portfolio management and yet oddly qualify as an underserved asset class. Catering to the celebrity of stocks, most research publications give bonds little more than a brief glance of coverage. Given the renewed market volatility and rising geopolitical risks there is no better time to brush up on fixed-income dynamics.
Thank you for your interest, let us know if you have questions or comments and we look forward to providing more details on RIA Pro over the coming weeks.
Sincerely,
Lance Roberts & Michael Lebowitz, CFA
Dashboard
Aggregated historical yields and returns for major fixed income classes

Rates
- U.S. Treasury securities
- Yields curves
- Supply and demand dynamics
- Fed Funds
- Stock/bond correlation
- Technical analysis
Interest Rates
- U.S. Treasury bills, notes and bonds are the most important market in the world as they establish the price/yield against which all other global assets are benchmarked.
- Although still at low levels, the recent rise in interest rates is primarily due to expectations for more U.S. Treasury supply to fund growing U.S. deficits as well as growing concerns for higher than expected levels of inflation.
- Led by the short-end of the yield curve (maturities less than 3 years), Treasury yields began rising in earnest following the historic lows of mid-2016.
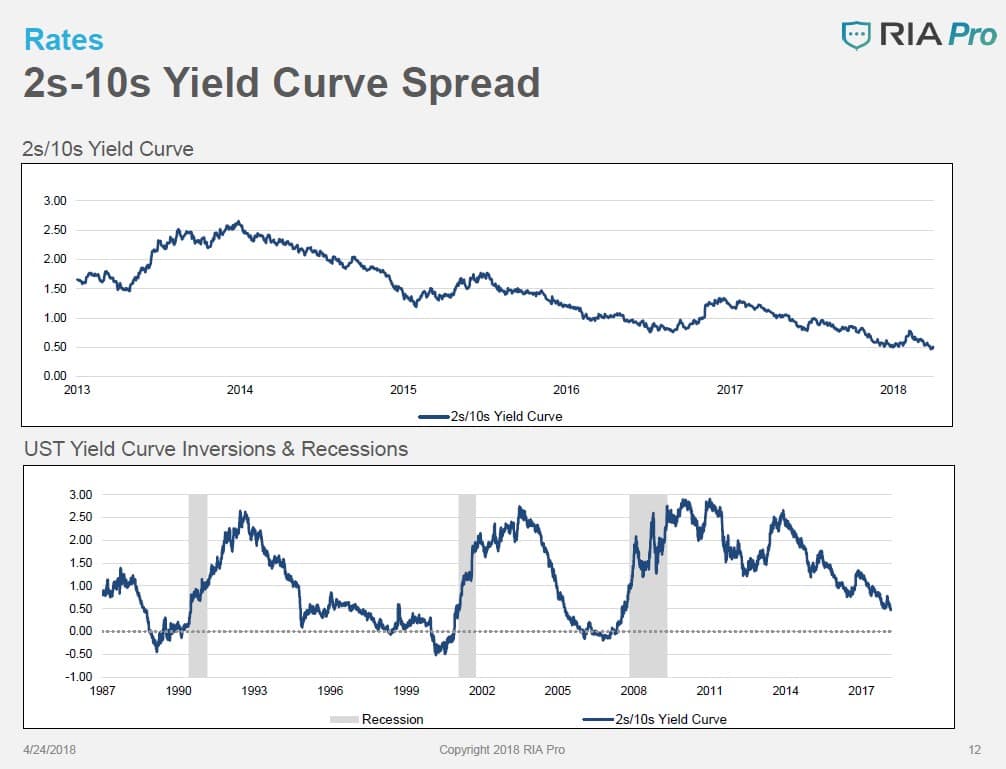
- The risk of a flatter yield curve lies in the possibility of inversion (2-Year yields rise above 10-Year Yields). Historically, this has provided an important recession warning.
- Yield curve flattening in current cycle more gradual and prolonged than in previous rate hike cycles.
- Gradual rate hikes by the Federal Reserve have begun to give way to a more methodical and steady pace.
- In addition to rate hikes, the Fed has begun to slowly allow their balance sheet to decline thus further removing liquidity from the system.
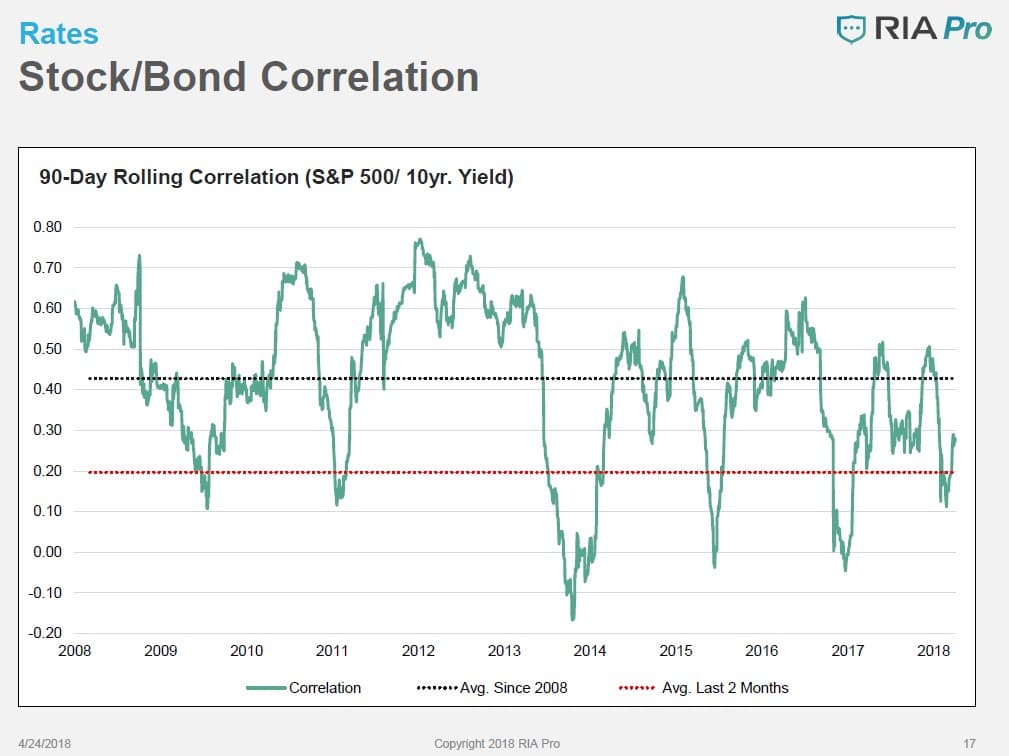
- Movement between stocks and bonds (correlation) is relatively low suggesting the traditional relationship of “stocks down-bonds up” may be changing.


Technicals
Long term analysis –UST 10 Year
Short term analysis –UST 10 Year
10-Year UST Technicals–Long Term
- Rates are currently pushing into 3-standard deviations of the long-term mean which historically has been a peak of price movements
- Rates are currently at the top of the their 30 year downtrend line which is likely to limit further advances in rates over the intermediate term
- Going back through history, peaks in rates typically correspond to financial and economic events from the Black Monday stock market crash of 1987, Long-Term Capital Management, the popping of the dot.com bubble, and most recently the great financial crisis of 2008
- RSI levels above 90 have always signaled peaks in rates
- Large deviations from the long-term mean has signaled previous peaks
- The y-axis on pages 20 and 22 are yields (for example 40= 4.00%).
Article by Michael Lebowitz, CFA – Real Investment Advice
720 Global is an investment consulting firm, specializing in macroeconomic research, valuations, strategic asset allocation, and risk management for investment managers. Our goal is to help our clientele achieve best in class service.
We believe you will find our research thought provoking and certainly unique.
Please contact us at mplebow@720global or 301.466.1204 with any questions, comments or to learn more about our services.
See the full PDF below.

