

Introduction
In this article and video we are going to cover Fidelity National Information Services.
The FAST Graphs fundamentals analyser software tool represents a powerful and dynamic first step towards analysing any stock. Consequently, we rightfully refer to FAST Graphs, as a tool to think with. But more than that, FAST Graph also provides a ton of fundamental data and ratios presented in easy-to-read graphical form. Once a subscriber becomes familiar and proficient with this powerful fundamental analyser tool, most say they would not even consider investing in a stock without analysing it through FAST Graphs.
Q1 2023 hedge fund letters, conferences and more
FAST Graphs Analyze Out Loud on Fidelity National Information Services
Our loyal subscribers will be familiar with the presentation below.
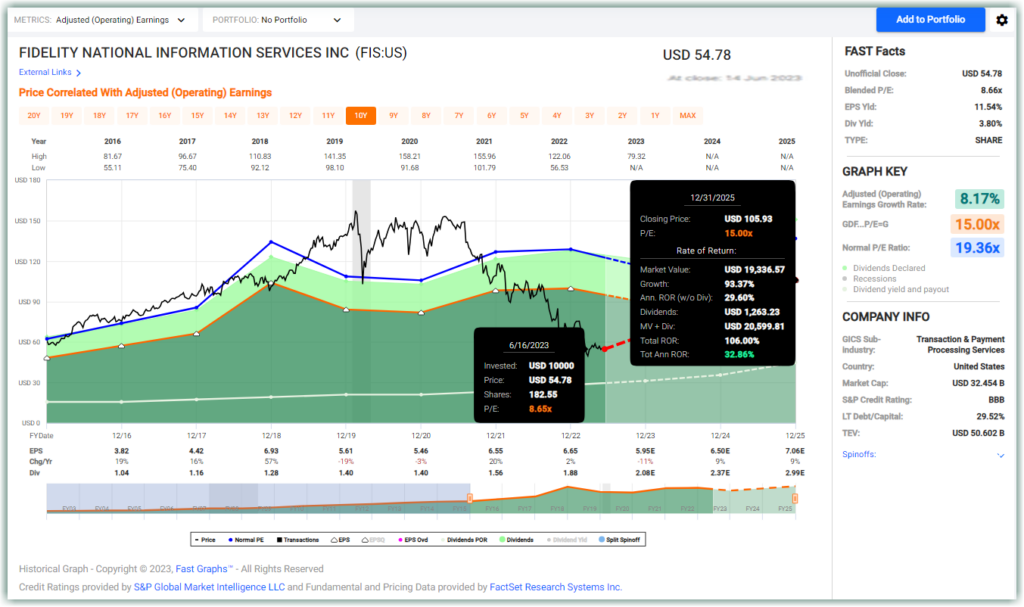
At a glance, you can see that Fidelity National Information Services (FIS) is undervalued. As of close on 14 June 2023, FIS was trading at a blended P/E of 8.66. Over the past seven and a half years, FIS had traded at a normal P/E of 19.36. Even considering the period between the Great Financial Crisis and prior to FIS’s $43 billion acquisition of Worldpay in 2019, FIS still traded at a normal P/E of 17.07. All FIS needs to do is to trade up to a blended P/E of 13.41 by the end of 2025 to reward shareholders who buy FIS shares at $54.78 a 32.86% annualized rate of return or a capital appreciation of 93.37% in less than three years.
FIS looks like an undervalued company that has huge potential for capital appreciation in under three years. Great!
There is more.
On the bottom right side of the panel (see below) is a brief summary of the company and what we like to see is the S&P Credit Rating and the LT Debt/Capital.
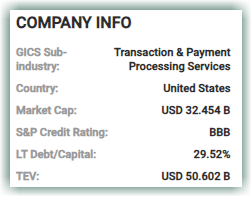
These tell us that FIS has an investment-grade level credit rating from S&P and that it has a relatively low LT Debt/Capital ratio. These imply that FIS appears to be a safe company that is unlikely to go bust.
Wait. There is still more.
When we select the “Performance” tab, we can see the following information.
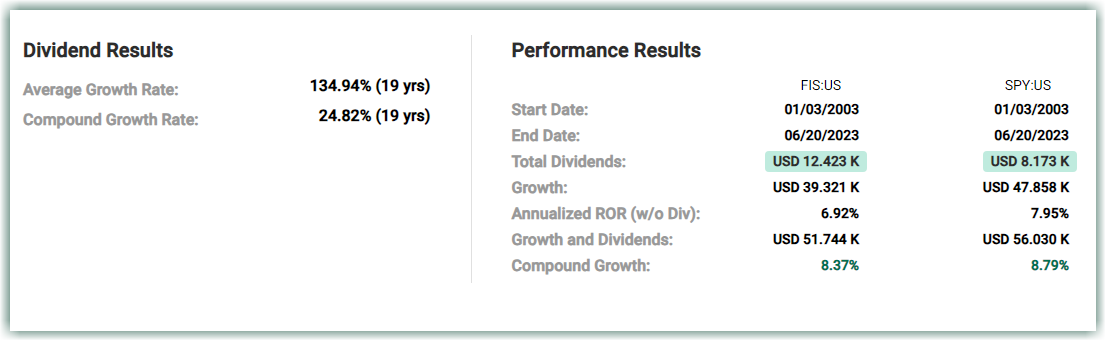
Interpreting this will help us consider if FIS is suitable to meet our investment goals. On the right, we see that FIS has slightly underperformed the index SPY over the last 19 years. However, we also see that FIS generated approximately 50% more dividends than an investment in the index would provide. On the left, we can see why: FIS is a dividend-compounding monster, with a dividend-compound growth rate of 24.82% over 19 years. For context, the dividends would have doubled after just 3.2 years at the rate of 24.82%, and in 19 years $1 would have ballooned into $67. Imagine collecting a mere $20 in annual dividends in 2003, and after holding FIS for 19 years, the payout will be $1353 annually.
However, it is our policy at FAST Graphs that measuring performance without simultaneously measuring valuation is a job half done. Stated differently, when measuring performance, the actual result is not meaningful unless you know why and how the performance was generated. Comparisons are best made when they are made on an “apples to apples” basis.
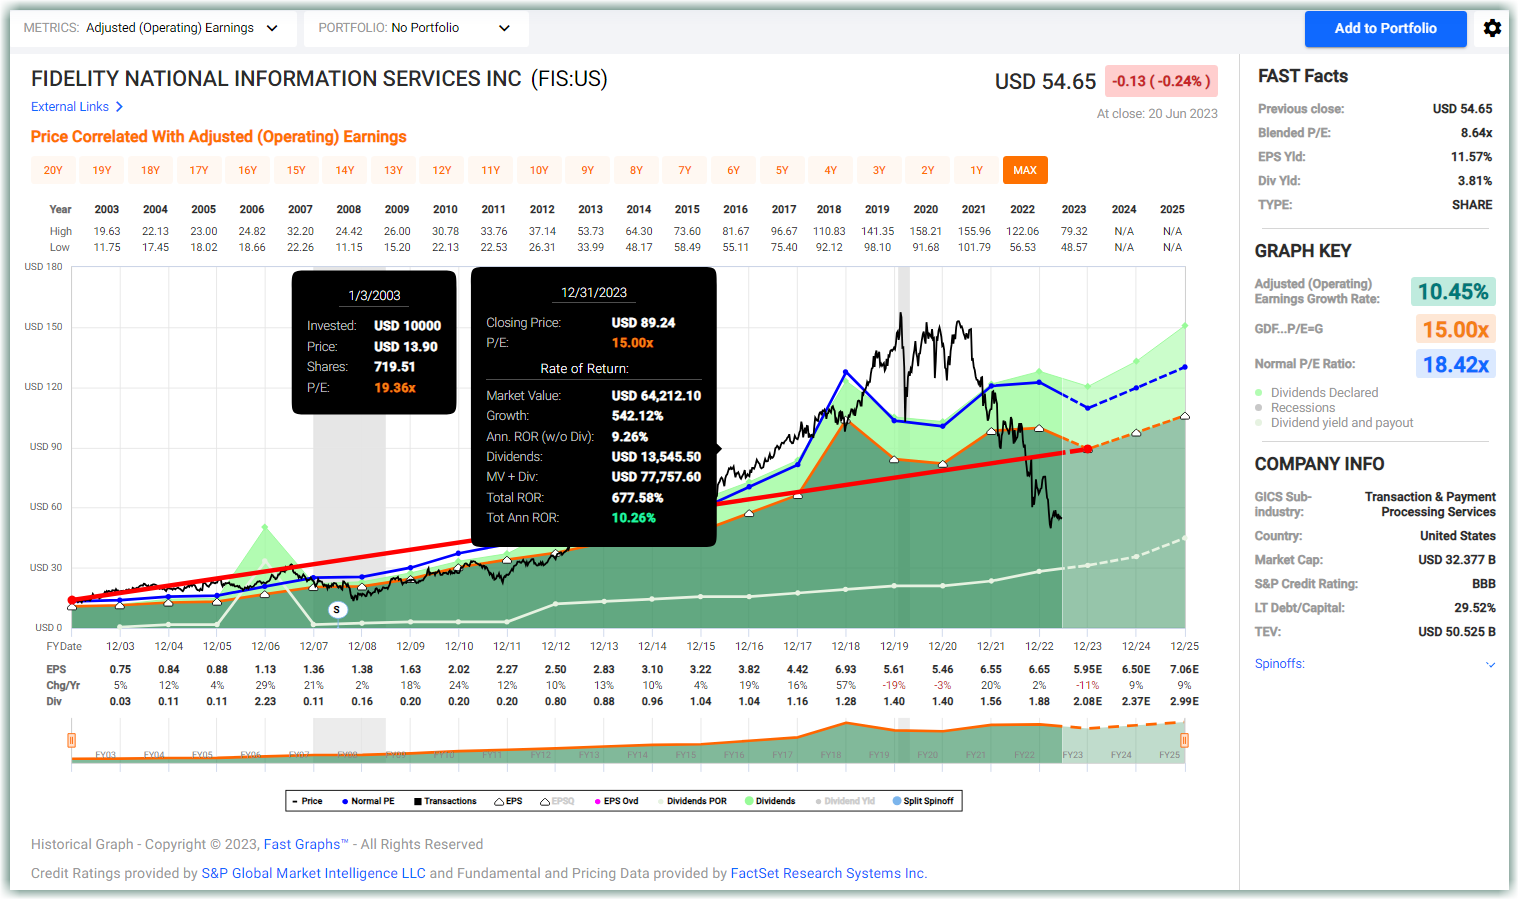
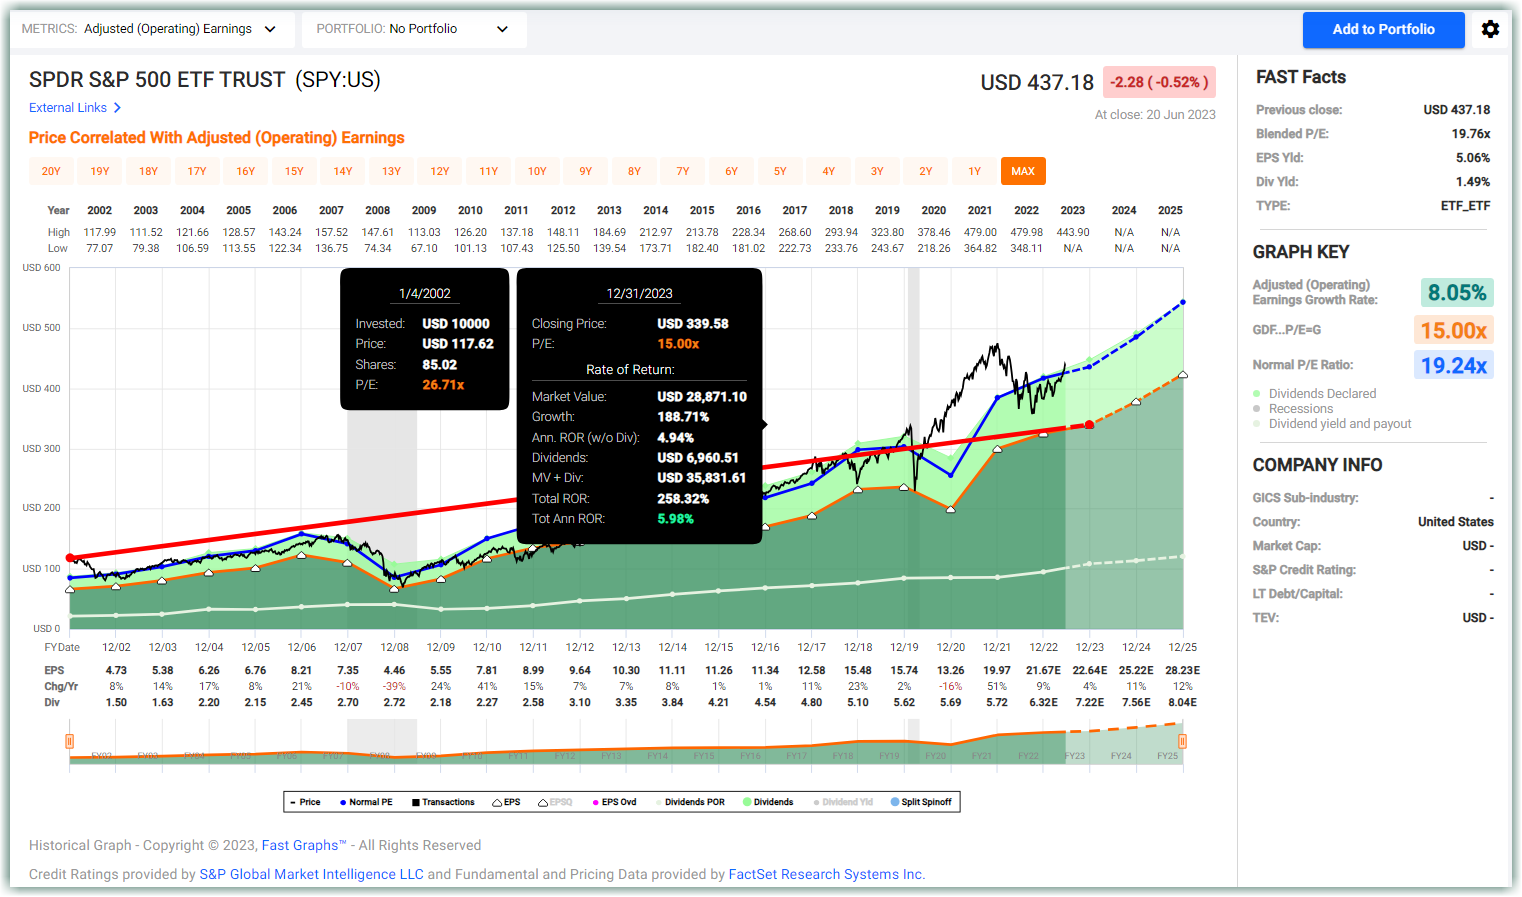
Therefore, it is important to point out FIS was moderately overvalued at the beginning of 2003 while SPY was highly overvalued at that time. But more importantly, SPY today is fully valued if not overvalued, while FIS is currently undervalued. The following two charts with performance calculated to theoretical fair value illustrate this point:
FIS the business grew earnings faster than SPY the ETF. Consequently, if performance were measured to fair value FIS would have (or should have) a return of 10.26% including dividends but not reinvested. Importantly, this return is consistent with the operating performance that the business actually generated over this timeframe.
In contrast, if the SPY’s performance was calibrated to fair valuation its performance would have been 5.98% which is slightly below the earnings growth rate but adjusted by the overvaluation at the beginning of the timeframe. Valuation matters, and it matters a lot but so does growth and fundamentals. Measuring one without considering the other is as previously mentioned a job half done.
Furthermore, regarding the dividend advantage of FIS over SPY, it is also important to point out that dividends are based on the number of shares owned and not the fluctuating stock price. In other words, stock price volatility had no bearing on the amount of dividends paid. Additionally, at the current payout ratio of just 28%, there does not seem to be any risk of a dividend cut; plus, there is a lot of room for the dividend to grow. FIS seems tailor-made and well-positioned with a margin of safety for Dividend Growth Investors.
Article by James Long & Chuck Carnevale, FastGraphs.

