

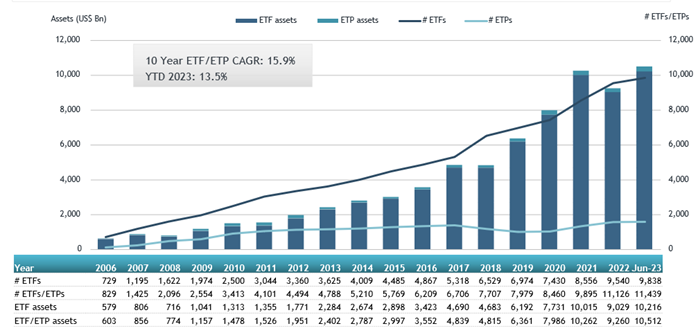
LONDON —July 18, 2023 — ETFGI, a leading independent research and consultancy firm covering trends in the global ETFs ecosystem, reported today that assets invested in the global ETFs industry reached a record US$10.51 trillion at the end of June. During June the global ETFs industry gathered US$103.06 billion in net inflows, bringing year to date net inflows to US$376.19 Bn. Year-to-date assets have increased 13.5%, going from $9.26 Tn at end of 2022 to $10.51 Tn, according to ETFGI’s June 2023 global ETFs and ETPs industry landscape insights report, the monthly report which is part of an annual paid-for research subscription service. (All dollar values in USD unless otherwise noted)
Q2 2023 hedge fund letters, conferences and more
Highlights
- Assets invested in the global ETFs industry reached a record of $10.51 Tn at the end of June.
- Assets have increased 13.5% YTD in 2023, going from $9.26 Tn at end of 2022 to $10.51 Tn.
- Global ETFs industry gathered net inflows of $103.06 Bn during June.
- YTD net inflows of $376.19 Bn are the third highest on record, after YTD net inflows of $658.91 Bn in 2021 and YTD net inflows of $462.53 Bn in 2012.
- 49th month of consecutive net inflows.
“The S&P 500 increased by 6.61% in June and is up 16.89% year-to-date in 2023. Developed markets excluding the US increased 4.46% in June and are up 11.07% YTD in 2023. Korea (up 2.23%) and Israel (up 1.51%) saw the largest increases amongst the developed markets in June. Emerging markets increased by 4.33% during June and are up 4.64% YTD in 2023. Pakistan (up 8.61%) and Turkey (up 5.85%) saw the largest increases amongst emerging markets in June.” According to Deborah Fuhr, managing partner, founder, and owner of ETFGI.
Global ETFs industry assets as of the end of June 2023

The Global ETFs industry had 11,439 products, with 23,285 listings, assets of $10.51 Tn, from 686 providers listed on 81 exchanges in 63 countries at the end of June.
During June, ETFs listed globally gathered net inflows of $103.61 Bn. Equity ETFs reported net inflows of $72.97 Bn during June, bringing YTD net inflows to $162.77 Bn, significantly lower than the $277.33 Bn in net inflows YTD in 2022. Fixed income ETFs gathered net inflows of $24.55 Bn during June, bringing YTD net inflows to $142.01 Bn, higher than the $84.47 Bn in net inflows YTD in 2022. Commodities ETFs/ETPs reported net outflows of $6.21 Bn during June, bringing YTD net outflows to $1.34 Bn, significantly lower than the $13.84 Bn in net inflows YTD in 2022. Active ETFs attracted net inflows of $10.69 Bn over the month, gathering YTD net inflows of $69.47 Bn, higher than the $63.87 Bn in net inflows YTD in 2022.
Substantial inflows can be attributed to the top 20 ETFs by net new assets, which collectively gathered $50.63 Bn during June. Vanguard S&P 500 ETF (VOO US) gathered $11.08 Bn, the largest individual net inflow.
Top 20 ETFs by net new inflows June 2023: Global
| Name |
Ticker |
Assets |
NNA |
NNA |
|
| Vanguard S&P 500 ETF |
VOO US |
325,929.89 |
20,539.00 |
11,082.63 |
|
| iShares Core S&P 500 ETF |
IVV US |
331,924.24 |
424.18 |
5,820.05 |
|
| Invesco S&P 500 Equal Weight ETF |
RSP US |
39,484.69 |
4,862.42 |
4,985.05 |
|
| Vanguard Total Bond Market ETF |
BND US |
94,348.41 |
8,699.24 |
2,432.89 |
|
| Vanguard Total Stock Market ETF |
VTI US |
308,192.70 |
7,859.34 |
2,239.62 |
|
| iShares Climate Conscious & Transition MSCI USA ETF |
USCL US |
2,254.70 |
2,166.39 |
2,166.39
|
|
| Financial Select Sector SPDR Fund |
XLF US |
32,539.46 |
1,820.43 |
2,161.70 |
|
| Invesco Nasdaq 100 ETF |
QQQM US |
13,739.12 |
5,254.48 |
2,067.47 |
|
| SPDR Portfolio S&P 600 Small Cap ETF |
SPSM US |
7,651.53 |
2,863.82 |
1,936.90 |
|
| iShares Russell 2000 ETF |
IWM US |
54,581.08 |
(1,093.16) |
1,844.79 |
|
| iShares iBoxx $ Investment Grade Corporate Bond ETF |
LQD US |
37,237.29 |
1,109.97 |
1,757.29 |
|
| iShares MSCI Japan ETF |
EWJ US |
12,725.53 |
2,448.44 |
1,631.74 |
|
| iShares Core U.S. Aggregate Bond ETF |
AGG US |
92,093.14 |
8,725.68 |
1,520.18 |
|
| iShares Core MSCI EAFE ETF |
IEFA US |
98,955.88 |
1,780.67 |
1,467.04 |
|
| SPDR S&P 500 ETF Trust |
SPY US |
423,341.47 |
11,551.54 |
1,372.91 |
|
| JPMorgan Equity Premium Income ETF |
JEPI US |
28,046.75 |
10,142.66 |
1,274.98 |
|
| iShares Core € Corp Bond UCITS ETF |
IEBC LN |
16,022.50 |
4,083.24 |
1,268.94 |
|
| iShares Core MSCI World UCITS ETF – Acc |
IWDA LN |
56,481.91 |
4,568.71 |
1,241.98 |
|
| Vanguard FTSE Developed Markets ETF |
VEA US |
113,644.15 |
3,393.10 |
1,180.86 |
|
| WisdomTree Floating Rate Treasury Fund |
USFR US |
16,988.84 |
3,875.64 |
1,174.46 |

The top 10 ETPs by net new assets collectively gathered $805.21 Mn over June. BTCetc – ETC Group Physical Bitcoin – Acc (BTCE GY) gathered $121.23 Mn, the largest individual net inflow.
Top 10 ETPs by net new inflows June 2023: Global


