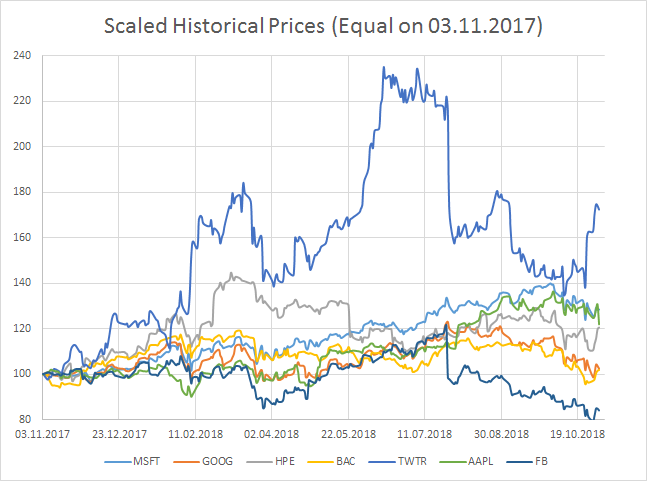
Smart investors know that the key to choosing which stock to buy or sell is a proper analysis of every stock’s price history.
Even if you have heard rumours about a particular company that imply its explosive future growth or its imminent demise, these rumours would have already left their footprint on that company’s traded stock price. Market is as fast - if not faster - than rumours! It is therefore important that you have access to both real time and historical data of all those stocks that fall under your radar screen.
In my previous article about live feeds in Excel I explained how you may get access to such feeds. In the current article I will confront the question about...