

Good morning!
In this week’s Dirty Dozen [CHART PACK] we go through the latest Fund Manager Survey, look at a record low allocation to tech, make the case to be cautious US stocks as well as the bull and bear takes for bond yields, before finally diving into some setups in crude, PM miners, and a LatAm E&P, plus more…
Q1 2021 hedge fund letters, conferences and more
Let’s dive in.
- Fund managers around the world are “unambigiously bullish”, a record majority expect “above-trend” growth and inflation, and they collectively have their lowest allocations to tech on record, according to BofA’s latest FMS. At some point Bernard Baruch’s dictum that “something that everyone knows, isn’t worth anything” will begin to matter as growth & inflation expectations over-discount probable paths. We’re not quite there yet but we’re getting close…


- Gavin Baker, a portfolio manager and favorite twitter follow of mine, made a compelling case the other week for buying secular growth stocks (link here). I’m not sure I’m sold yet on growth’s prospects at the moment. Many of the big names (AAPL, AMZN, NFLX, etc…) are in large Stage 3 distribution phases. With that said, it’s always important to have a few names researched and ready to go should the picture change.

- The below chart from NDR is one I like to check in on from time to time. It shows “Excess Liquidity Growth” as measured by M2 money supply – industrial production x PPI Commodities (YoY). The measure recently turned negative for the first time since September 18’. Historically, the SPX sees an average -5.62% annual return following such readings.

- Our base macro case calls for a top in the economic growth rate (delta) within the next 2-3 months followed by a deceleration, while maintaining a high level.
The NY Fed’s Nowcast shows growth already slowing some. But this is largely due to pervasive supply and labor bottlenecks. Manufacturers can’t get the inputs they need to finish goods and employers can’t hire enough people — likely because many of are choosing to stay at home and collect the boosted UI benefits.
It’ll be interesting to see what happens when these issues are largely resolved later in the year.

- This magazine cover annotated chart from @MacroCharts shows how far the Narrative Pendulum has swung, in regards to inflation and yields, over the past year.

- While I expect yields to hit somewhat of a durable ceiling in a few months, the data we track says the path of least resistance is up for now at least.

- We’ll need to keep a close eye on our leading inflation indicator (black line). It’s still trending up though it did recently see its first significant MoM decline in over a year.

- We’re not too interested in the US equity market at the moment — broadly speaking, we still very much like a number of idiosyncratic names. Outside of the US though, there’s a number of great setups. Take India’s Nifty 50 for example. It’s in a Bull Quiet regime and breaking out of a 4-month compression zone.

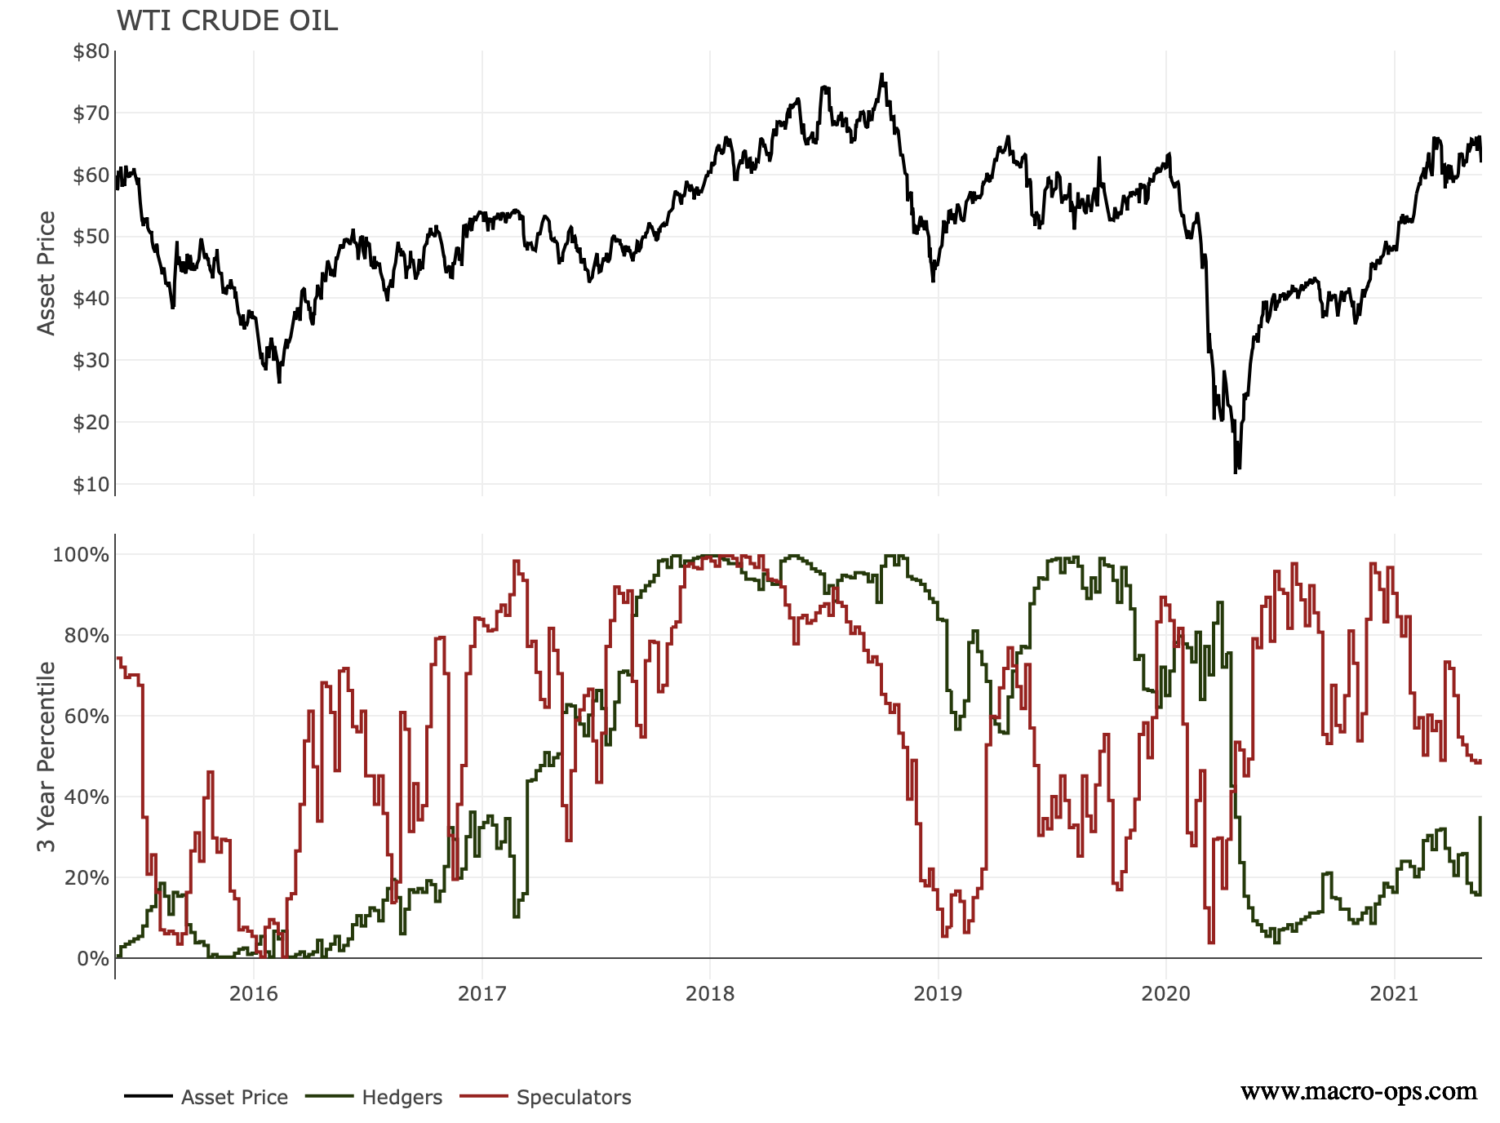
- The commodities in the red box highlight a good jumping off point for further research. These names are trading in either Neutral or Bull Quiet regimes. We can then use seasonality and positioning extremes to further filter the markets we should focus on. This is the process of stacking conditional edges upon edges, so we’re only playing in the most fertile fields.
Through this process, we get crude, gold, palladium, and platinum. Oil for example is trading in a 3-month sideways compression range, in a BullQ regime, and net specs are in their 48th %-tile of its 3-year average (adjusted for OI). WTI just bounced off its lower Bollinger Band. So if you wanted to get long, this level is not a bad R/R one to do so.


- Precious metals continue to be my primary focus. It’s the largest position in our book and one I want to keep adding to on pullbacks.
You can read our framework for analyzing gold and silver here. A great way to play this budding trend is in small-cap miners. The tapes in that space are setting up for lift-off. GLDG is one of these names (I have a position).

- Sentix provides a high-value signal regarding sentiment analysis of the crypto market. I’ve been following them for years and have found their work to be quite useful. With that said… if you’re still long a bunch of cryptos, you might want to heed their words below.
“Despite the sharp price losses in cryptocurrencies, there is still no sign of an end to the downward movement. Even if tactical countermovements are very likely after such significant price losses, the sentix data do not yet indicate an end to the correction phase. On the one hand, the sentix asset class sentiment signals a clear turning away of investors from the asset class. The news situation and the price development have contributed to a considerable loss of confidence. On the other hand, the basic strategic confidence does not signal a positive trend reversal either.”

- If you want long exposure to oil and Latin America then the Mexico-based ADR VIST might be worth a look. The company operates oil and gas assets primarily in Mexico and Argentina. It’s selling for cheap at 2.5x next year’s earnings and is breaking out of a massive 18-month compression zone.


Stay safe out there and keep your head on a swivel.
Article by Macro Ops


