

 Hedge Fund News
News
Stay on top of the latest hedge fund news with Hedge Fund Alpha! The investment world is always in motion, so it’s never been more important for investors to stay informed on what hedge funds are doing. We bring you timely, accurate reporting on top hedge funds like ValueAct, Citadel, Greenlight Capital, Third Point, Pabrai Investment Funds and more. Dive into the diverse perspectives presented by Hedge Fund Alpha and go behind the headlines here. Hedge Fund Alpha is your go-to source of hedge fund news. From breaking news to developing stories, we have our fingers on the pulse of the hedge fund community and investment universe. Check out all the top headlines here with Hedge Fund Alpha.
Hedge Fund News
 Hedge Fund News
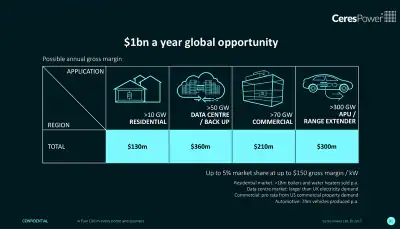
Grizzly Research: Ceres Power’s Revenue Is Tiny; Story Is Hype
 Press Releases
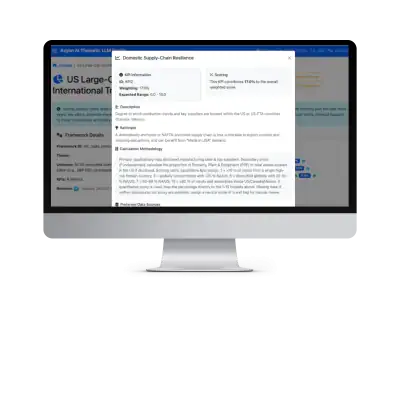
Axyon AI launches game-changing Agentic AI platform for thematic investing: Axyon Foresight
 Press Releases
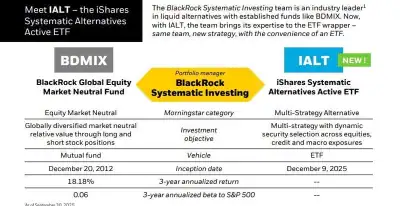
BlackRock Expands Liquid Alts with New Multi-Strategy Active ETF IALT
 Press Releases
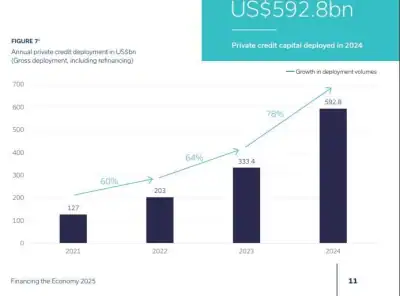
Strong growth sees private credit market reach $3.5 trillion
 Value Briefs
Berkshire Hathaway Announces Leadership Appointments; Todd Combs To Leave & Join JPMorgan
 Hedge Fund News
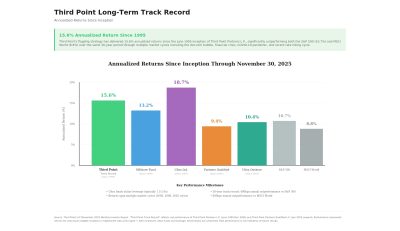
Third Point Dumps Primo Brands Amid “Overestimate”; Sells Out Of Meta & Apollo, Reduces Amazon Stake [Exclusive]
 Press Releases
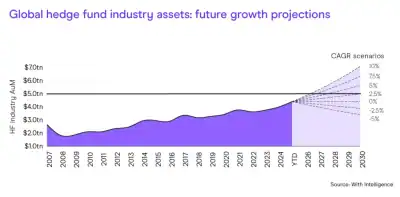
Hedge Fund AUM Could $7 Trillion By 2030; UAE Fund Launches Soar; Smaller Multi-Strat Catch Up: HFR
 Press Releases
AIMA’s ACC backs Bank of England’s new private markets stress test
 Fintech/AI
Japan Investment Corporation (JIC): US SWF and its Investments in AI Supply Chain

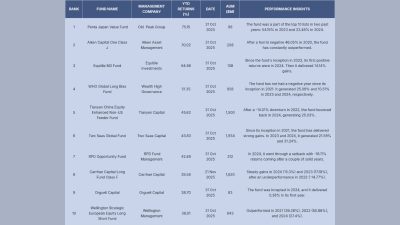
Wealth Management And Private Bank Demand For Hedge Funds Up 10% In 2025

Private credit braces for the BoE’s latest take; UK Shortselling Rules Timeline
 Hedge Fund News
The “Head of Macro” Can’t Find the Download Button: Fishback In Trouble As Greenlight Seizes Assets
 Markets & Macro
Why Emerging Managers Must Pay Attention To Domicile
 Markets & Macro
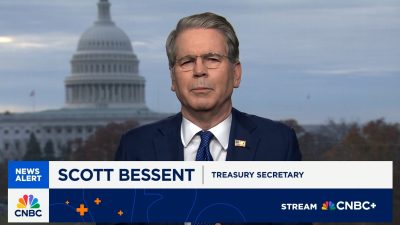
Bessent Predicts ‘1990s Scenario’: Eyes AI-Driven Productivity Boom And Non-Inflationary Growth
 Press Releases
Retail Traders Lost 74-89% During Every Major Volatility Event: Study
 Hedge Fund News
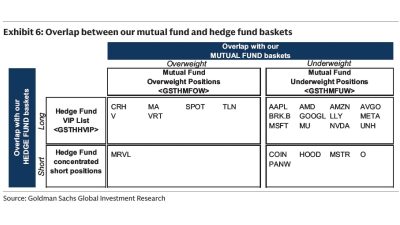
The Six Shared Favorite Stocks Among Mutual And Hedge Funds Aren’t Among The Mag Seven
 Press Releases
Frost Bank Implements Derivative Path To Power OTC Derivatives Business
 Press Releases
ACC Board Changes; First Brands Group Examined From A Private Credit Perspective
 Hedge Fund News
