
Talk of a trade war with China has recently dominated the discussion in financial markets, overshadowing the other major story playing out in the US economy—normalization of the energy markets. I thought I would answer the question of whether trade with China or oil was a bigger economic issue.
[REITs]
Q1 hedge fund letters, conference, scoops etc, Also read Lear Capital: Financial Products You Should Avoid?
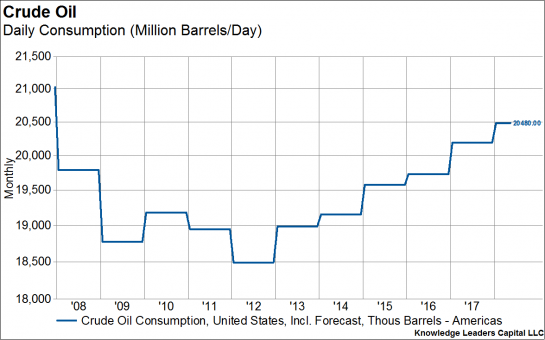
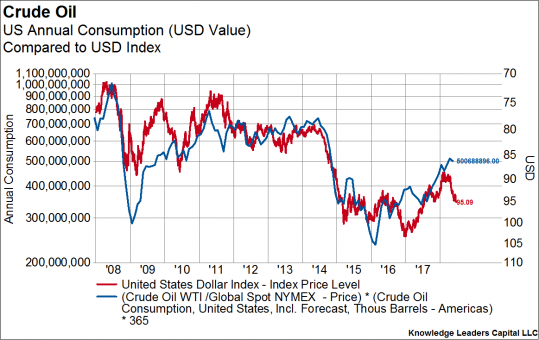
Currently the US consumes about 20.4M barrels oil per day. This works out to about $500B on an annualized basis if we use the current price of WTI ($65/barrel) multiplied by 365 days.
Using the most recent monthly trade figures, the 12-month sum of the US trade deficit with China is $388B. In the chart below, I compared the two series over the last decade.
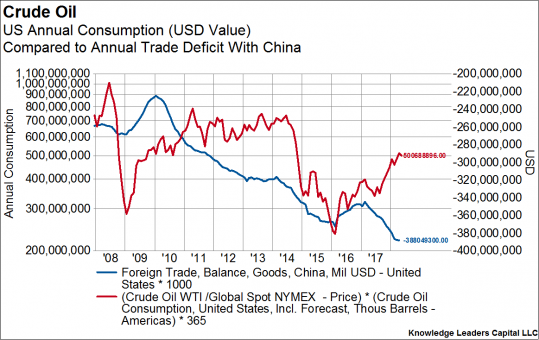
For about a month in early 2016, the size of the US trade deficit with China was larger than US crude oil consumption, but as of today, US crude consumption on annual basis is about 25% larger than the trade deficit with China.
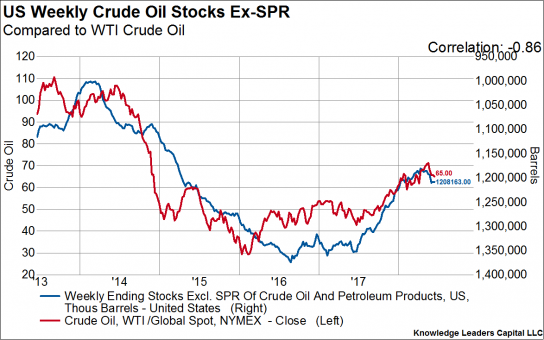
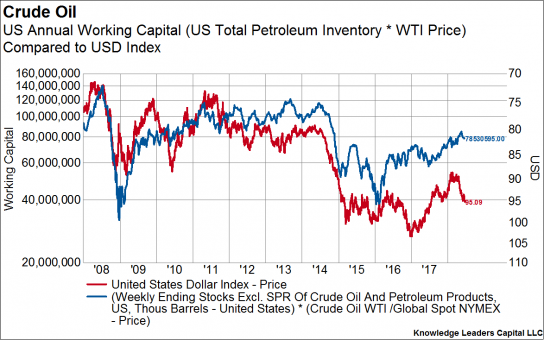
We shouldn’t forget that the US has about 1.2M barrels of crude and refined product held in inventory.
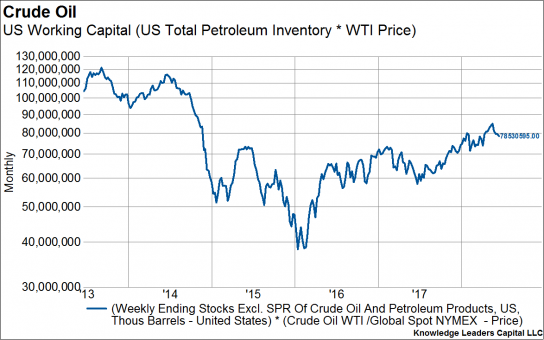
Again, using the current price of WTI, the US has about $78 billion tied up in working capital to finance the inventories. Note: refined products are about two-thirds of these inventory figures, and a barrel of gasoline at $2/gallon comes out to $84/barrel (42 gallons in a barrel). So, these are conservative estimates.
So, US daily consumption plus inventories costs close to $600B compared to a $388B trade deficit with China. In other words, the petroleum market in the US is about 35% larger than the trade deficit with China.
This is why energy prices and inventories are so important when thinking about the USD. As the price of oil changes, the amount of USD required to finance that consumption rises. The annual energy bill fell from about $750B in 2013-2014 to a trough of about $300B in 2016, releasing huge amounts of “spare” USD. Result: the USD rose. Since 2016, as oil prices have more than doubled, the annual energy bill is about $500B, thus tying up more capital. Result: USD falls.
The dynamics are similar when we consider the working capital needs of financing all the petroleum inventories. Working capital requirements were about $100B annually in 2010-2014, dropping to $40B in early 2016. As working capital demands fell, releasing USD liquidity, the USD rose. As working capital demands have increased, reaching back to $80B annually, the USD has fallen.
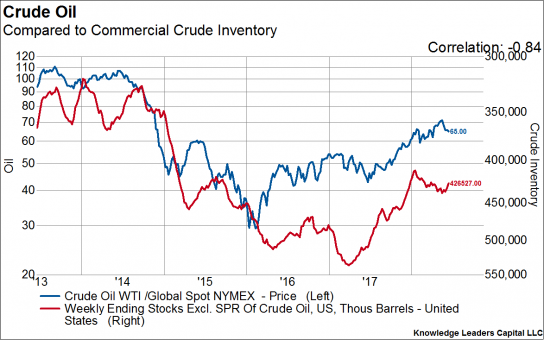
This is why we watch so intently the weekly crude oil inventory figures. Today, there was another large drop in weekly crude inventories (just crude, not including refined product). There is a very high correlation between crude inventories and the price of crude. Inventories drop = prices rise.
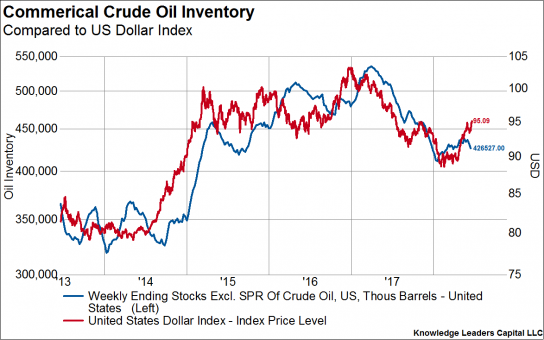
In turn, there is a very high correlation between crude inventories and the USD. With inventories steadily rolling over again, the move higher in the USD (based on safe haven flows, scared by the prospects of a trade war) appears to have overshot.
Trade wars are not something the market has a ton of experience with, and the way the President appears to be dealing with China is confusing and cryptic at best. But, at the end of the day, the energy market in the US is a much bigger economic force than our trade deficit with China. At some point, the currency market will regain its head and realize this.
Article by Knowledge Leaders Capital

