
“The best insurance policy against missing big market moves is to have more than one online brokerage account.” – Barron’s, March 11, 2000
[timeless]
Q2 hedge fund letters, conference, scoops etc
If you feel it appropriate, share this piece with your client(s). It’s about late cycles, investor behavior and risk management. It was fun for me to write. I do hope you find it helpful. Let’s start with a look back to early 2000.
March 11, 2000 excerpt from Barron’s:
The market is moving like mad. You log on to the Internet, open your bookmark file, and click on your online broker’s listing. There’s a delay. Then you wait a little longer. Check your e-mail. Go back to the broker’s site. And wait. And wait. Then pound the keys and cuss. In the meantime, the market is running away from you, and you’re certain the delay just cost you some money.
Dear reader, rest assured you’re not alone. A couple of weeks ago, I was trying to execute a trade with a full-service broker. First, his line was busy for a couple of hours. His assistant wouldn’t take my order because it involved exercising stock options. I had to fax them a document, but the fax line was tied up. It took me over a day of trying to get through before my order was processed. I won’t complain too loudly, though; the stock went up $7 while I listened to busy signals.
What’s the point? Assume delays and slowdowns are inevitable during market frenzies, no matter what the mode of trading. Frankly, while waiting on hold and listening to the fax machine’s busy signals, I was wishing this full-service broker had an online option.
Remember back then? Fax machine busy signals! I can hear my kids now, what’s a fax machine? That was what life looked like at the market top in March 2000. Was your broker or advisor rejecting your buy orders back then? I doubt it – everyone wanted in.
Let’s keep today’s post short as Labor Day weekend is immediately ahead and I’m sure you have a fun weekend planned. I’ve been writing a lot about late-cycle behavior lately. Last week, I noted we’ve set a new bull market longevity record.
With this in mind, there is an important point I’d like to make and it has to do with the best piece of advice I received in my more than 33 years in the business. The great Sir John Templeton told me in 1985, “The secret to my success is that I buy when everyone else is selling and I sell when everyone else is buying.” Adding, “It sounds easy but it will be one of the hardest things for you to do.”
WHEN WE LOOK AT CHARTS OF THE MAJOR market indexes, we see breakouts across the board and that’s a good sign. But the ranks of stocks pushing the indexes higher have thinned somewhat and while not a reason to hit the sell button on its own, it is something to monitor.
The Standard & Poor’s 500 saw its best weekly point and percentage gain since March and rose 42, or 2.8%, to 1526. The Nasdaq Composite Index climbed 69, or 2.7%, to 2671 and has rallied in four of the past five weeks. The Russell 2000 increased 30, or 3.8%, to 813.
Whether such optimism will be rewarded remains to be seen.
It didn’t get rewarded. Stocks peaked one month later in October 2007 and what followed was The Great Financial Crisis. ” … breakouts across the board and that’s a good sign.” It wasn’t. Eventually, on March 6, 2009 the S&P 500 Index bottomed at 666.
Our friends at Ned Davis Research monitor how investors were allocated over time, across stocks, bonds and money market vehicles. It’s interesting to see how investors’ allocations trend and while precise timing is impossible we can identify periods, based on investor behaviors, that lead us to market inflection points. Let’s take a look at Tech Bubble (March 2000) and the Great Financial Crisis (October).
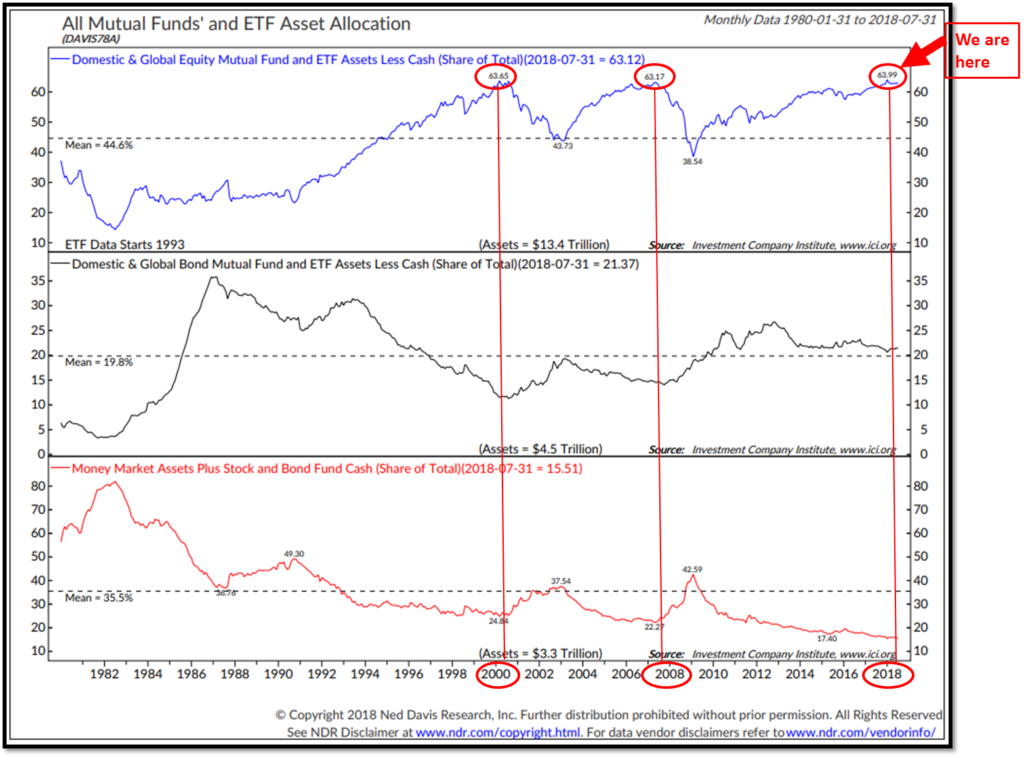
Here’s how to read the chart (Red is bad):
- The data is 1980 to present and measures U.S. household allocations to mutual funds and ETFs.
- The upper section of the chart plots the percentage of investors’ portfolios allocated to stock funds.
- During the spring of 2000, just after the Tech Bubble peaked, investors had 63.56% (top of chart, red circle) of their portfolios in stock funds, 11.51% in bonds and 24.84% in cash.
- In October of 2007, as the Great Financial Crisis was unfolding, investors again had high allocations to stocks (top of chart, middle red circle 63.17%).
- This summer, investors’ allocations hit a record high 63.99% (top of chart, right red circle.)
- Bottom line: When investors are heavily invested in stocks, there is less money available to drive prices higher. More buyers than sellers and prices rise. More sellers than buyers and prices drop. The law of supply and demand exists in everything. Where is the money going to come from, at this late stage in the cycle, to drive prices higher? Take a good look at the chart and then let’s look at the other side of the equation.
IN 1937, AUTHOR JOHN STEINBECK penned “Of Mice and Men,” a Depression-era based novel about how even the best plans seem to go awry. In today’s financial markets, it seems that market analysis is following that script. The overwhelming market influence today is the financial crisis and it has rendered our regular assumptions of a liquid market place and active legions of bulls and bears invalid.
The undercutting of the November low of 741 in the Standard & Poor’s 500, as well as the drop below the previous bear market lows in 2002, has forced investors and analysts alike to rethink their entire market values systems.
We shook off the failed strategy of buy and hold in the last bear market but always maintained hope that stocks are the best asset class to own for the long-run. But what is the definition of “long-run” now? Is it 10-years? The Dow Jones Industrial Average is now at its lowest point in 12 years.
We’ll be seeing similar commentary after the next dislocation. The high level of equity ownership and leverage (record margin debt) in the system will be one of the drivers.
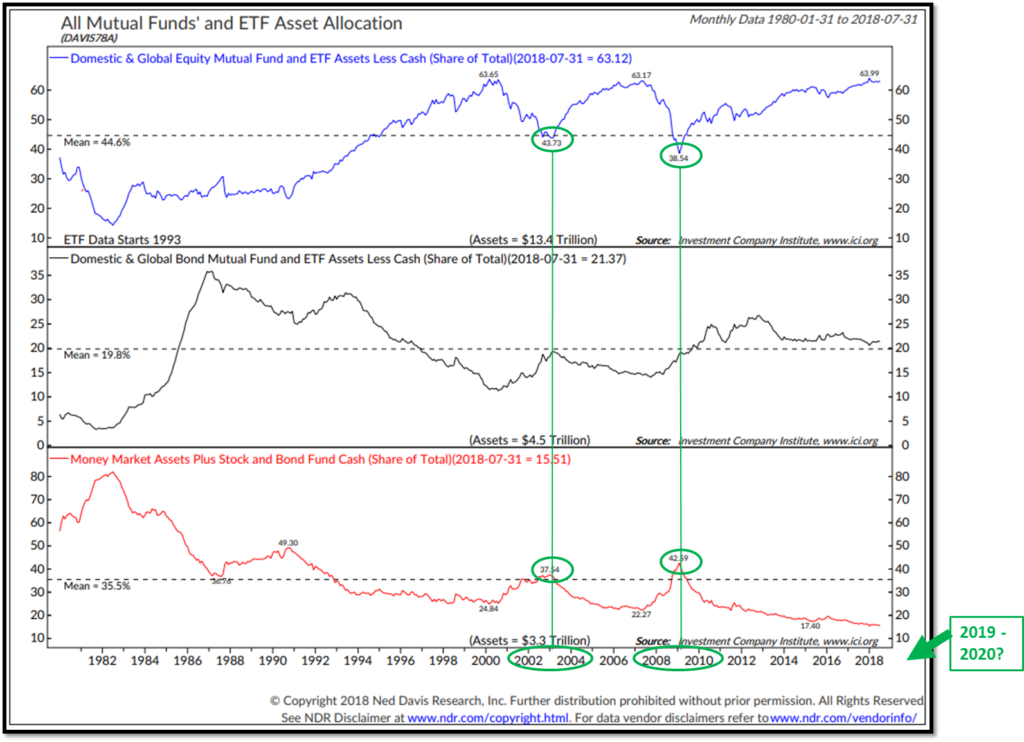
Next chart, same look – different perspective: 2002, 2009 and 2019-2020 (the next great buying opportunity???)
Here’s how to read the chart (Green is good):
- The data is 1980 to present and measures U.S. household allocations to mutual funds and ETFs.
- The upper section of the chart measures the percentage of investors’ portfolios allocated to stock funds.
- In late 2002, in the wake of the Tech Bubble popping, investors had only 43.73% (top of chart, green circle) of their portfolios in stock funds, 18.27% in bonds and 37.54% in cash. That cash is from panic selling.
- In early 2009, in the depths of deep recession, equity weightings stood at 38.54% (top of chart, right green circle) and cash at 42.59% (bottom of chart, right green circle).
- Bottom line: When investors are underweight equities and overweight cash, there is more future money available to drive prices higher. More buyers than sellers and prices rise.
“We shook off the failed strategy of buy and hold in the last bear market.” Right! Common wisdom today is that active strategies have failed. They haven’t. It’s just where we are in the cycle.
You get my point. Investors buy and sell at the wrong time. I think Sir John has it right. It’s time to be greedy when others are fearful and it’s time to play defense when others are greedy. We can measure this in terms of portfolio weightings, valuations and other investor sentiment metrics.
What you can do – Participate and Protect.
A simple risk managed trend following process can help. The great trader, Paul Tudor Jones said, “My metric for everything I look at is the 200-day moving average of closing prices. I’ve seen too many things go to zero, stocks and commodities. The whole trick in investing is: ’How do I keep from losing everything?’ If you use the 200-day moving average rule, then you get out. You play defense, and you get out.”
It’s time to play defense but as you’ll see next, it is not yet time to get out. So “Party on Garth, Party on Wayne.”
Over the last 15 years, 92.2% of large-cap funds lagged a simple S&P 500 index fund. The percentages of mid-cap and small-cap funds lagging their benchmarks were even higher. It is nearly the best track record over your lifetime and mine. In August 2018, the market set the record for the longest bull market in history surpassing the 1990 to 2000 run. Can we agree we are late cycle in this bull market? Do you know when the next great downturn is? I don’t. Nor does Paul Tudor Jones, Stan Druckenmiller, Ray Dalio or Warren Buffett.
I prefer a rules-based process based on what price behavior is telling us. For example, the 200-day moving average rule gets you out when the price of the S&P 500 drops below the moving average price trend line. It gets you back in when it rises above. My favorite process is the NDR CMG Large Cap Long/Flat model process. I post the latest signal each week in Trade Signals.
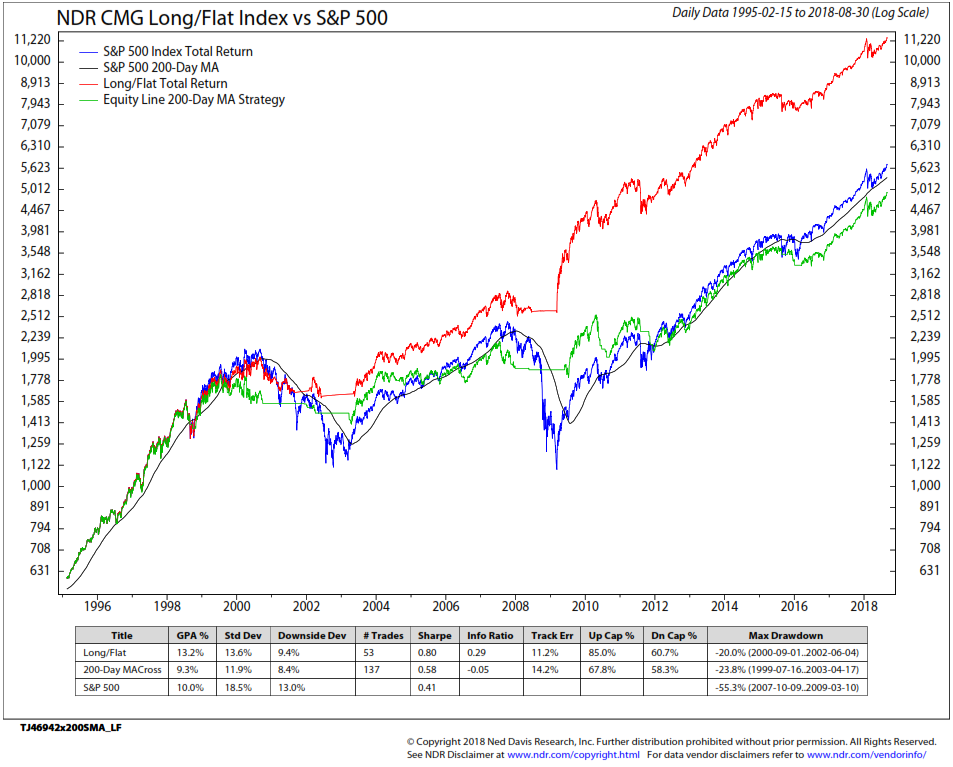
Here is a back-tested comparison of NDR CMG U.S. Large Cap Long/Flat Index vs. the back-tested 200-day moving average long/flat rule vs. the hypothetical S&P 500 Total Return Index:
- Blue line is the S&P 500 Index Total Return. Assumes a hypothetical $500 initial investment in February 2005. S&P Dow Jones Indices is the calculation agent of the index.
- The thin black line is the 200-day moving average line of the S&P 500 Index.
- The green line is the hypothetical growth on $500, using the 200-day moving average rule, from the same February 2005 starting date to present.
- The red line is the total hypothetical growth on $500 for the NDR CMG Large Cap Long Flat Index from February 2005 – present. S&P Dow Jones Indices is the calculation agent of the index.
- The values shown vertically on both the right and left side of the chart are dollar values.
- Bottom line: Note the performance differences in the bottom section of the chart. GPA % means ‘Gain Per Annum’ or annualized gain. Std Dev means Standard Deviation. It is a measure of risk taken to achieve the return. Lower is better. Also take a look at Max Drawdown on the far right of the data box. Simply, if you had $1 million invested, a 55.3% max draw down means your $1 million declined in value to $447,000 at its worst point. A 20% drawdown means your $1 million declined to $800,000 at its worst point.
Important Disclosures: CMG, NDR, S&P Dow Jones Index link, S&PDJ Disclosure
If your client, like days past in 1999 and 2007, is comparing his broad diversified portfolio performance to the S&P 500 Index, then give him or her an option like the 200-day moving average rule or NDR CMG U.S. Large Cap Long/Flat Index or something you believe gives him or her the ability to move his assets out of the stock market during the next major decline.
Side note: We co-created the NDR CMG U.S. Large Cap Long/Flat Index with Ned Davis Research because we felt many people use the 200-day moving average rule and while I’m in Paul Tudor Jones’s camp on risk management, I believe there are too many investors and investment managers using the 200-day moving average rule. When you get too many people doing the same thing on the same index at the same time, the trade is ripe to attract fast trading poachers who can force the market to trigger your trade and cause too many false trades. I believe the 200-day moving average rule will still work, I just believe we can do better by doing something a little different and also avoid getting poached.
I explain in Trade Signals how the NDR CMG U.S. Large Cap Long/Flat process works and I post the signal each week. It’s posted free each week. There is no guarantee in this process nor any investment process. If you’d like to learn more, send me a note at blumenthal@cmgweath.com. One of our advisor reps will get you the information to help you take a deeper dive.
Passive is in favor today just as it was in 1999. Active was front page in 2002 and 2009/10. For now, channel your inner Sir John. Have a process in place to manager risk.
♦ If you are not signed up to receive my weekly On My Radar e-newsletter, you can subscribe here. ♦
Follow me on Twitter @SBlumenthalCMG
Included in this week’s On My Radar:
- Trade Signals — Equity Trend Continues to Roll; NDR CMG U.S. Large Cap Long/Flat Index Moves to 100% Equity Exposure
- Personal Note — Wishing You a Wonderful Labor Day Weekend
Trade Signals — Equity Trend Continues to Roll; NDR CMG U.S. Large Cap Long/Flat Index Moves to 100% Equity Exposure
S&P 500 Index — 2,900 (08-29-2018)
Notable this week, the Ned Davis Research CMG U.S. Large Cap Long/Flat Index moved to 100% exposure to large-cap equities, up from 80% exposure. Additionally, however, the Ned Davis Research Daily Trading Sentiment Composite moved to “Excessive Optimism,” which is generally a bearish indicator for equities. The week’s reading is nearly 67 (up from 61), implying a 6.75% decline in the S&P 500 Index 30% of the time. The Fixed Income, Economic Indicators and Gold signals remain unchanged since last week.
On Monday, August 27, the Nasdaq Composite breached 8,000 for the first time in history. The achievement was largely attributed to the news of U.S.-Mexico trade discussions and renegotiation of NAFTA. Today, there are reports of Canada now coming to the negotiating table in an effort to reach a true North American trade deal.
For additional commentary, click HERE for the latest Trade Signals.
Important note: Not a recommendation for you to buy or sell any security. For information purposes only. Please talk with your advisor about needs, goals, time horizon and risk tolerances.
Long-time readers know that I am a big fan of Ned Davis Research. I’ve been a client for years and value their service. If you’re interested in learning more about NDR, please call John P. Kornack Jr., Institutional Sales Manager, at 617-279-4876. John’s email address is jkornack@ndr.com. I am not compensated in any way by NDR. I’m just a fan of their work.
Personal Note — Wishing You a Wonderful Labor Day Weekend
Now is the time to seize the day
Stare down the odds and seize the day
Minute by minute that’s how you win it
We will find a way
But let us seize the day
– Seize The Day lyrics, Ben Fankhauser, Jeremy Jordan
My days of racing from one soccer field to another have gotten easier. With four of six away in college and daughter Brianna working in NYC, only Kieran, Susan’s youngest remains at home. It sure has gotten quiet around the house and honestly it’s taking me some time to adjust. I wasn’t expecting that. This weekend Kieran has two games near Stone Harbor, New Jersey. It’s one of our favorite east coast beach towns. I’m not sure why they are playing near the Jersey Shore but we are going to seize the day.
September starts tomorrow! Hard to believe… and next week the pace kicks back into high gear. I’m in New York City September 10 and 11, Dallas mid-month and back to NYC on the 25th and 26th. But first, a beach chair, a book and downtime with Susan is immediately ahead. Happy about that…
Wishing you and your family a fun filled weekend!
♦ If you are not signed up to receive my weekly On My Radar e-newsletter, you can subscribe here. ♦
With kind regards,
Steve
Stephen B. Blumenthal
Executive Chairman & CIO

