Disclosures
General Disclosure:
The views herein are solely the views of the author and do not represent the views or policies of Hudson Bay Capital. This material is intended for information purposes only, and does not constitute investment advice, a recommendation or an offer or solicitation to purchase or sell any securities to any person in any jurisdiction. The opinions expressed are as of November 2025 and are subject to change without notice. Reliance upon information in this material is at the sole discretion of the reader. Investing involves risks. Hudson Bay does not undertake any obligation to update or revise any statement or information or correct any inaccuracies whether as a result of new information, future events or otherwise. This presentation may not be shown, copied, distributed or given to any person without the authorization of Hudson Bay. This information is not intended to be complete or exhaustive and no representations or warranties, either express or implied, are made regarding the accuracy or completeness of the information contained herein. This material may contain estimates and forward-looking statements, which may include forecasts and do not represent a guarantee of future performance. To the extent permitted by applicable law, none of Hudson Bay Capital Management LP, Hudson Bay Capital UK LLP, Hudson Bay Capital Associates LLC, Hudson Bay International Associates LLC nor their respective affiliates, officers, directors, employees, principals or agents will be liable to you or any other person for any errors or omissions in the production or content of this representation, nor will they under any circumstances be liable to you or any other person for any loss or damage (whether direct, indirect, special, incidental, economic, or consequential, exemplary or punitive) arising from, connected with, or relating to the use of, or inability to use, this presentation, or any action or decision made by you or any other person in reliance on this presentation, or any unauthorized use or reproduction of this presentation.
Executive Summary
One common refrain in markets and media is that “stocks are expensive” with some even calling today’s market a speculative bubble. While we agree that the P/E multiple is elevated relative to history, we don’t see high P/E as a binding constraint against valuation expanding further. Rather, AI-related technological progress and resulting broadbased productivity gains could lead to renewed market optimism and a commensurate “sentiment premium” in the market, along the lines of the 1985-2001 period. Such optimism, combined with current levels of interest rates, could justify an S&P 500 level of $9,000 (+34% relative to S&P trading at $6,7001) or more over time. Investors who myopically focus instead on the recent history of P/E multiples risk missing out on such generational upside. Moreover, the options market prices a mere ~8% probability of the S&P reaching that lofty level in the next two years. We think the true probability is much higher. At Hudson Bay, we invest holistically, question the experts, and remain aware of macro trends. With this paper, and its companion published by Hudson Bay Senior Economic Strategist Nouriel Roubini, we invite readers to join us in this approach.
Also see:
- 2025 Sohn London Conference: Hudson Bay’s Jason Cuttler – AI Could Drive S&P 500 To 9000
- Tech Trumps Tariffs: US Exceptionalism And The AI Productivity Boom - Hudson Bay Research
- 2025 Sohn London Conference
I). What the Media and Sell-Side Get Wrong
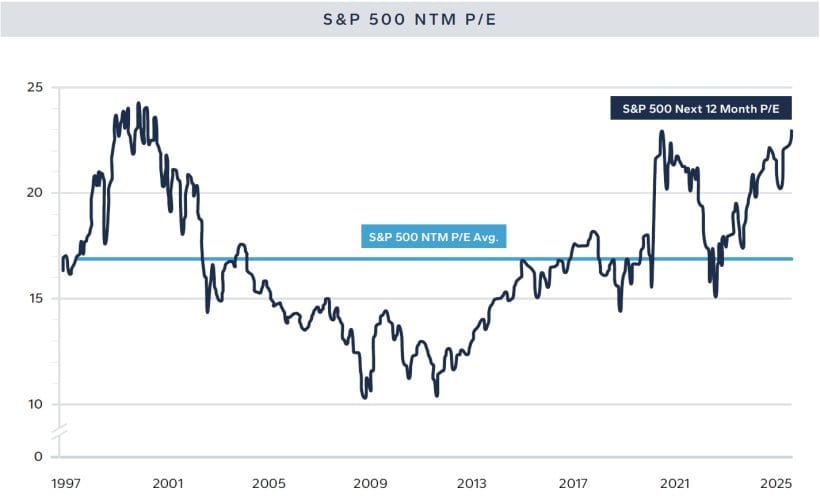
The first chart below is a version of one which has been flooding our inboxes for several years. The moving line is a time series of the S&P 500 P/E multiple with the horizontal line the simple average of this time series through the time shown. Pundits across the media and sell-side banks use this chart to argue that stocks are expensive and encourage investors to hedge or avoid stocks. See, for example “Bubble Fears Resurface Amid US Equities Valuation Highs” in the October 10th Financial Times or “US Stocks Are Now Pricier Than They Were in the Dot Com Era” in the August 31st The Wall Street Journal. We don’t dispute that P/E multiple is elevated versus the historical average. Nor can we guarantee that stocks will go up. However, this simple recent history P/E analysis makes three critical behavioral errors that we challenge in this paper.
- Myopia: Simple P/E time series analysis implies that the P/E multiple should be static over time, failing to look more broadly or dynamically as to what drives a “correct” P/E multiple. This makes no sense to us. Rather, P/E multiples should be high when there is large demand for stocks and low when there is less demand for stocks. Demand (or lack of) in turn is a function of long-term economic growth prospects, demographics, corporate cost of capital, sentiment, and investor cost of capital. None of these inputs are constant, so there is no reason why the P/E multiple should be constant.
- Recency bias: Similarly, looking back at the past generation and assuming that the next one will look the same is overly simplistic. Specifically, the last twenty years were dominated by post-GFC quantitative easing suppressing interest rates, lack of major productivity gains (secular stagnation), a demographic plateau, and environmental / social considerations distorting economic incentives. To the extent the next twenty years look different, we shouldn’t expect a similar P/E multiple or even use recent history as a starting point for expectations over the next twenty years.
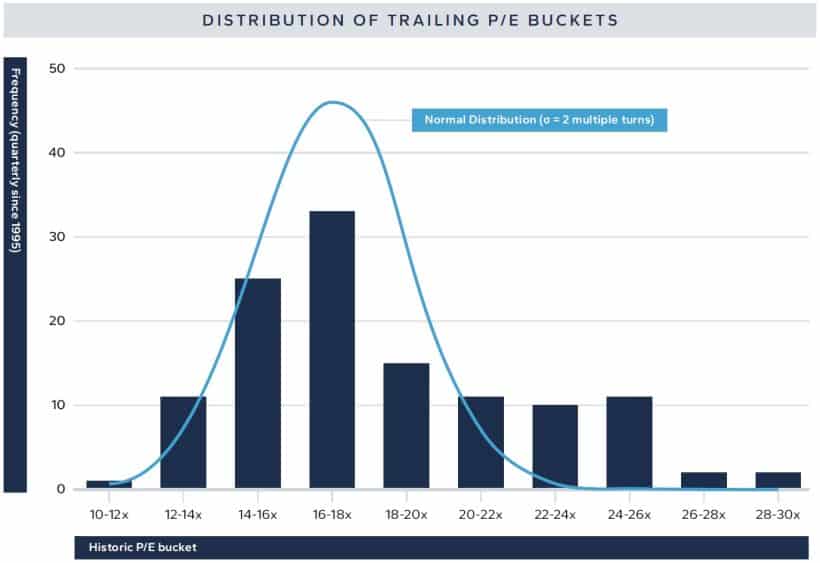
- Anchoring bias: A common analytical shortcut is to draw a simple horizontal line through the history of P/E multiples to indicate an average level. While this makes for an intuitive visual, it also reinforces an anchoring bias – the human tendency to treat historic averages as objective references2. Put simply, the horizontal line incorrectly implies that there is an objectively “correct” P/E multiple and that markets will mean revert to that level over time. Unfortunately, equity valuation is more complicated and the simple time series is neither normally distributed3 nor mean reverting. The static horizontal line is more pernicious than it seems at first. The second chart below plots the same time series as a distribution. We overlay the actual data (blue bars) with a simple normal curve (light blue line) centered at the series mean and using the series standard deviation. Assuming a normal distribution underestimates the right tail, which can be a particularly costly mistake for equity investors.
II). A Better Way: Regime-Based Valuation
We believe equity valuation will always be a function of human judgement, and that judgement should be informed and nuanced by thoughtful historic regime analysis. On this basis, we estimate S&P 500 fair value at $9,000 in an “optimism” regime and $5,200 in a “pessimism” regime. To reach these estimates we (i) replace simple P/E multiple with a more nuanced metric of earnings yield vs bond yield, adjusted for a regime-dependent “sentiment spread,” and (ii) identify two recent regimes to quantify the “sentiment spread” based on our understanding of market conditions.
As a first principle, P/E multiples are crude proxies for equity valuation. Cross-sectional examples help illustrate the over-simplification. Most would agree that Apple should trade at a higher P/E multiple than Alcoa because Apple’s long-term growth prospects are stronger than Alcoa’s (all else equal). Growth prospects similarly vary through time. We would also expect Apple to trade at a higher P/E multiple than America Movil, in part because US companies benefit from cheaper debt capital than those based in Latin America. Cost of capital similarly varies through time. We prefer to value equity markets based on the earnings or cash flows that they produce over time, discounting those cash flows back to today. This approach is technically a Gordon Growth Model 4 but rhymes with other approaches such as discounted cash flow or the Fed’s equity valuation model. On this basis, we can summarize the value of an equity using a perpetuity formula:
Fair Value = Earnings per share / [Risk-free rate − (Long-term growth - Risk premium)]
Earnings per share are observable and one can make various smoothing adjustments through time for volatile cycles. We use a simple trailing 12-month EPS for simplicity and to avoid forecast biases. The risk-free rate is observable and we use the 30-year US Treasury bond5 for valuing US equities in order to look far into the future and capture substitution effects as investors necessarily decide whether to own infinite duration stocks or very long duration bonds. Unfortunately, neither long-term growth expectations nor the risk premium are observable at any moment of time. However, just because they are unobservable doesn’t make zero the correct input (as some macro-oriented strategists over-simplify). For our purposes, we will define a “sentiment spread.” Our construct delivers a high/positive sentiment spread when markets are optimistic and a low/negative sentiment spread when markets are pessimistic:
Sentiment spread = (Long-term growth expectations – Risk premium)
Ideally, we would untangle the sentiment spread through time between its two components, but the exercise proves futile6. After all, the risk of a corporate bankruptcy (stock to zero) is generally lower when a company has a strong growth profile and vice versa. The sentiment spread is meant to capture broad demand for equities, after accounting for interest rates. If demand for equities is high, we’d expect the sentiment spread to be high after accounting for interest rates. If demand for equities is high, we’d expect the sentiment spread to be high or positive. Investors buying equities in these times are willing to pay more for equities today in anticipation of long-term growth prospects and low perceived structural risk. Conversely, the sentiment spread should be low/ negative when investors are more worried and/or expect little long-term growth. We can restate:
Fair Value = Earnings per share / [Risk-free rate − Sentiment spread]
III). Optimism or Pessimism?
History isn’t a great indicator of future returns, but we’d be remiss not to analyze past markets to help quantify where the sentiment spread has been and where it may go from here. We now calibrate two historic periods of sentiment spreads, attempting to avoid the trap of recency bias. Algebraically, we re-arrange the formulas above and solve for the “sentiment spread” through time introducing contemporaneous stock prices (S&P 500) as an input. By construction, this approach assumes the market to be at “fair value” at any given time, albeit with that fair value in turn dependent on market sentiment which we seek to quantify.
Sentiment Spread = Bond Yield - Earnings / Market price
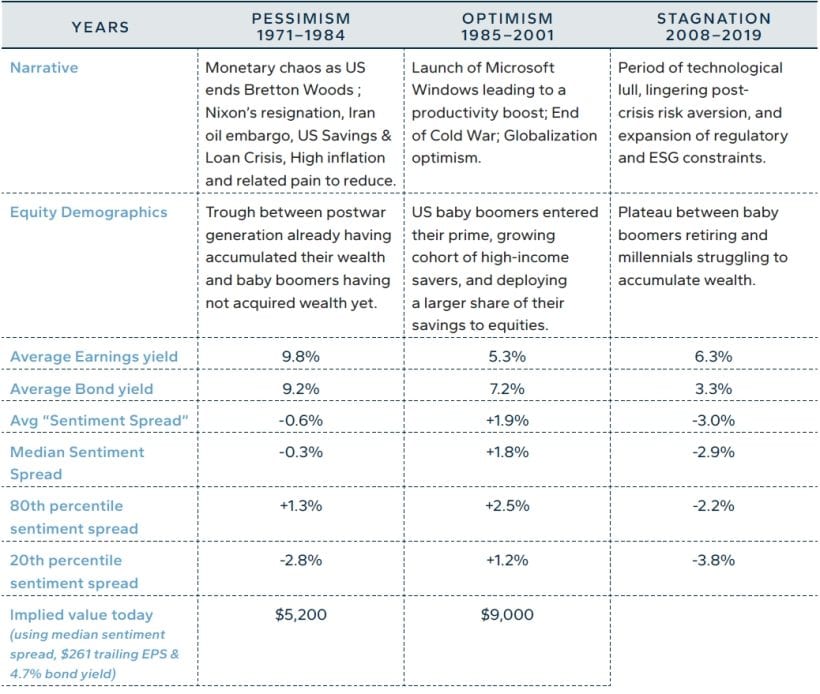
Consider 1985 to 2001 as a period of “optimism.” This period begins with the launch of Microsoft Windows ultimately leading to a productivity boost across the US and global economy benefiting technology companies and others alike. In addition, this was a period of optimism with the end of the Cold War creating a peace dividend, then magnified by optimism regarding globalization. This period included the launch of Euro common currency and process to admit China into the World Trade Organization. We close the period with the September 11th terror attacks which turned market attention and sentiment from economic prosperity toward physical security. While not specifically related to technology or optimism, this was also a time when US baby boomers entered their prime, growing the cohort of highincome savers, and deploying a larger share of their savings to equities.
At S&P 500 = 9,000, the trailing P/E is ≈ 34× on $261 EPS — high versus history, but consistent with techno-optimism, low interest rates, and improving savings demographics.
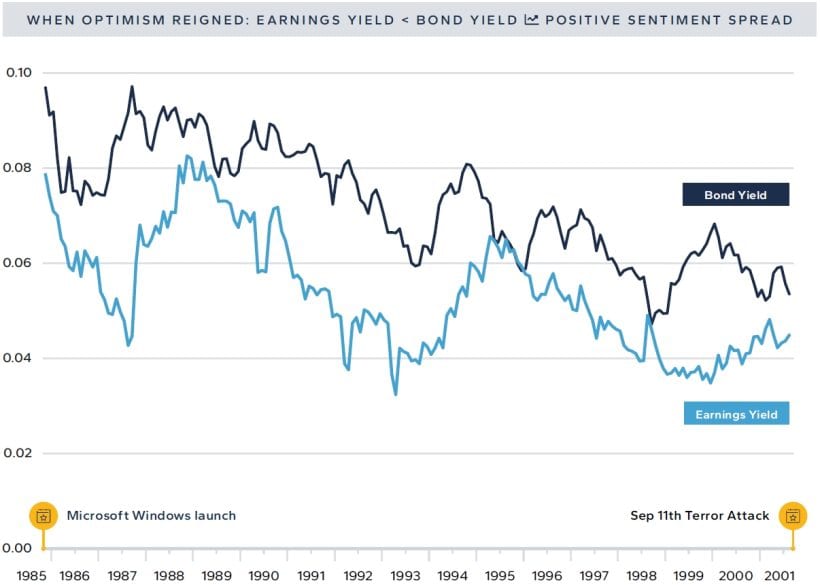
Over this period, the sentiment spread (dark blue line – light blue line) was positive by a median of 1.8%. Even excluding 1990 and 1991 as recessionary years where low earnings contemporaneous earnings could skew the results, the spread was essentially the same. Over the whole period, the sentiment spread was in the optimism zone by 1% or more in 161 of 191 months. Said differently, the earnings yield over the period was generally below the bond yield as investors paid up for the prospect of strong future growth without too much fear needing to bake into a risk premium.
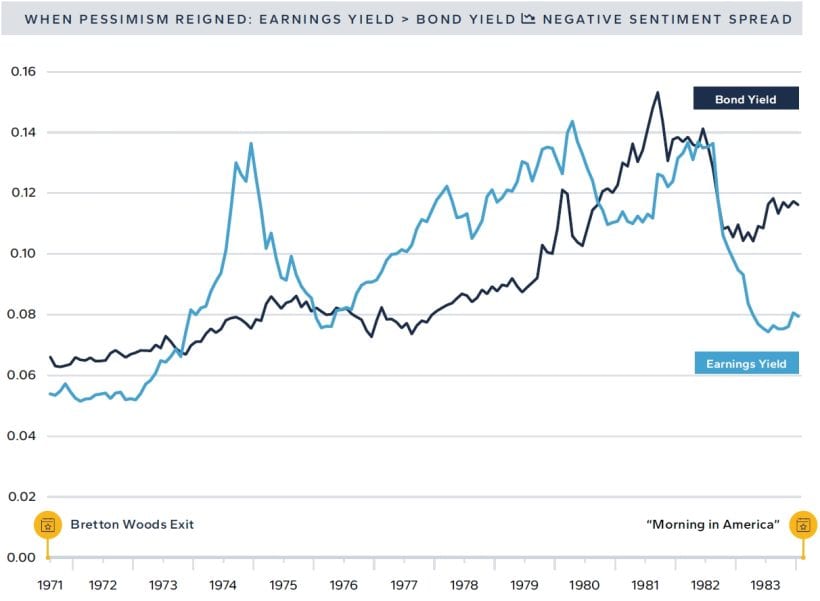
By contrast, we define 1971 to 1984 as a period of “pessimism.” The period starts with the US exit from the Bretton Woods monetary system and goes on to encompass Nixon’s resignation, Iran’s oil embargo, the US Savings & Loan crisis, and the subsequent need for hawkish monetary policy to bring inflation under control. Innovation was limited in this period without any major productivity-enhancing breakthroughs. As Robert Gordon convincingly argued in The Rise and Fall of American Growth, “advances since 1970 have tended to be channeled into a narrow sphere of human activity… for the rest of what humans care about – food, clothing, shelter, transportation, health, and working conditions, progress slowed after 1970, both qualitatively and quantitively7.” This period was also a demographic valley for the United States — a trough between the postwar generation already having accumulated their wealth and the baby boomers who had yet to start accumulating.
We mark the end of pessimism with Ronald Reagan’s “morning in America” campaign pivoting the US economy from pessimism to optimism. We could have terminated the period instead with the end of the 1982 recession, but prefer to hone in on economically-exogenous events to avoid being biased by cyclical noise. Unsurprisingly, the sentiment spread was pessimistic/negative in this period with investors only buying stocks at lower valuations. In the chart below, the light blue line (earnings / market level) is generally above the dark blue line (bond yield) by a median of 0.3%. Fundamentally, the market signaled an equity risk premium above the forward through-cycle growth rate.
Looking more recently, the period between Lehman’s collapse in 2008 and the eve of COVID in 2019 offers an important case study. Economist Tyler Cowen8 called this decade “The Great Stagnation,” arguing that advanced economies had exhausted their “low-hanging fruit” of growth — technological breakthroughs, educational expansion, and frontier markets. Former U.S. Treasury Secretary Larry Summers9 described the same period as “secular stagnation,” a prolonged era of chronically insufficient demand and low real interest rates. The 2008 crisis had revealed deep structural weaknesses in over-leveraged financial systems and household balance sheets across major economies. Policymakers responded as firefighters, doing “whatever it takes”10 to contain damage and stabilize the system. Central banks slashed policy rates to zero and bought long-dated government and agency bonds to reduce long-term yields. Despite ultra-aggressive monetary and policy accommodation, the economic recovery proved disappointingly shallow.
In hindsight, ultra-low interest rates failed to catalyze broad-based investment and economic growth in a time period defined by technological lull (post-Internet, pre-AI), lingering post-crisis risk aversion, an expanding web of regulatory and ESG-related constraints, and a demographic plateau between baby boomers retiring and millennials struggling to accumulate wealth. Through our regime-based valuation lens, investors assigned a hyper-negative median negative 300bp sentiment spread (earnings yield > bond yield) over this period. Evidently, pessimism around weak long-term growth prospects overwhelmed any optimistic sentiment around having contained an existential market crisis. Despite economic stagnation and pessimistic valuation, S&P 500 delivered returns around long-term average — rising ~9% annually from the eve of Lehman’s collapse in September 2008 to COVID-19 in late 2019. In our analysis, S&P appreciation reflected the underlying inputs of ultra-low interest rates and positive earnings growth off a depressed base rather than a revaluation. Had the market disagreed with Cowen and Summers, it would have overlayed an optimistic valuation on top of low interest rates and rising earnings, driving an even more powerful rally (all else equal).
IV). S&P 500 Fair Value to $9,000 if the Sentiment Spread Moves to Optimism
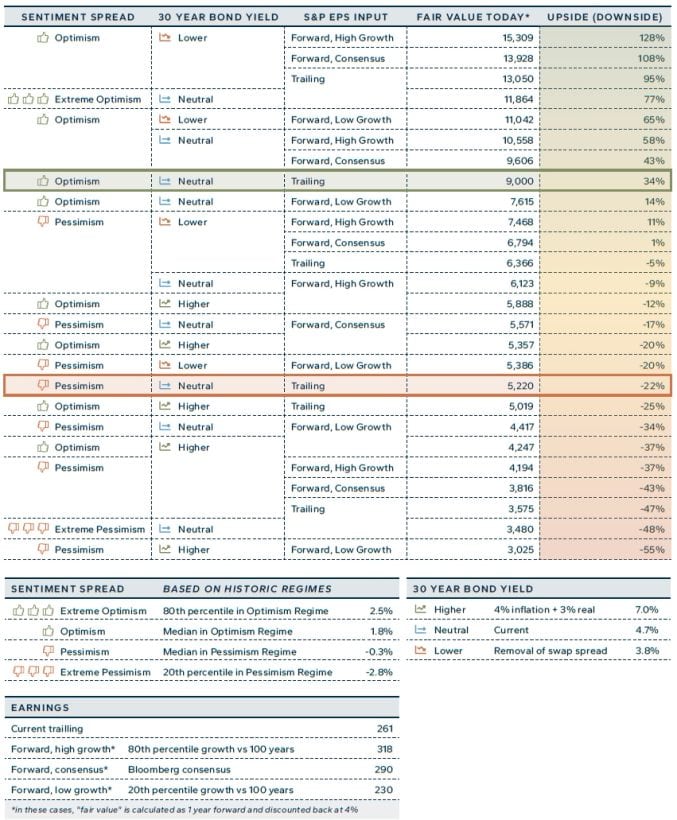
It is impossible to know for certain whether the economy will enter a period consistent with optimism, pessimism, or something in between. Further, it is even harder to know the timing and degree to which investors will price such a scenario into stocks. But we can use this framework to define fair value ranges for equities based on (i) the prevailing level of US 30-year Treasury bond yields, (ii) S&P 500 earnings, where we focus on trailing 12 months, and (iii) sentiment spreads consistent with each of the historic regimes. Based on this approach, we find S&P 500 at $6,700 still closer to $5,200 (-22%) pessimism valuation than $9,000 (+34%) optimism valuation.
The case for pessimism was more prevalent during early 2025, but shouldn’t be ignored going forward and still infiltrates market pricing. The pessimism of the 1970s was defined by geopolitical risk, a monetary system in transition (including the inflation spike and need to control it), and President Nixon’s resignation. Investors can make a credible case that similar drivers are in place today. President Trump’s America First foreign policy is geopolitically disruptive (for good or for bad is yet to be determined). The monetary system is once again in transition following President Biden’s weaponization of the SWIFT system against Russia, which forced reserve managers to reevaluate the dollar as a store of value. US domestic politics today are highly divisive, perhaps as divisive as they were in the early 1970s. We estimate fair value in a pessimism regime at $5,200.
Pessimism Fair Value = EPS trailing / Bond Yield today - Sentiment Spread pessimism = $261 / 4.7% - (-0.3%) = $5200
Returning to an “optimism regime” would likely be achieved through a revival of US manufacturing, rising domestic labor market participation, AI innovation percolating through the economy, and a stable world order under US hegemony. Such outcomes are consistent with President Trump’s “MAGA” policy goals which include higher tariffs to motivate domestic manufacturing, restricting immigration to reduce supply of foreign-born workers, rolling back regulation to allow AI and other new industries to thrive, and a US-led world order. Whether such policy goals are achievable remains to be seen.
As our companion paper by Nouriel Roubini argues, AI-led productivity and policy guardrails can outweigh stagflationary drags, making an ‘optimism’ regime plausible, not fanciful.
Further, demographics today look more like 1985-2001 (optimism) than 1971-1984 (pessimism) or 2007-2023 (stagnation). Looking ahead, while the US population of prime age earners/savers is only growing marginally, their wealth is growing substantially with inheritance and their appetite for equities appears higher than that of previous generations11. To us, a more “optimistic” valuation seems appropriate – even if it means challenging previous P/E multiple highs. We estimate fair value in an optimism regime at $9,000.
Optimism Fair Value = EPS trailing / Bond Yield today - Sentiment Spread optimism = $261 / 4.7% - (+1.8%) = $9000
V). Sensitivities – More Worried About Bond Yields than EPS Delivery
This paper is focused primarily on regime-based valuation and understanding market narratives and ranges for our “sentiment spread.” To apply this spread to derive a market fair value, we input earnings per share and the underlying bond yield. These are exogenous to our framework (we use trailing 12-month EPS for S&P 500 and the yield on US 30-year Treasury bonds).
S&P 500 trailing EPS stands at $261, consistent with valuations of $5,200 and $9,000 for pessimism and optimism respectively. Considering various scenarios:
- Looking at earnings data since 1871, bottom quintile earnings growth is -12%12. Reducing the $261 by 12% would reduce EPS to $230. In the unlikely event that all else remains constant, our fair values would shift to $8,000 optimism and $4,600 pessimism.
- On the flip side, top quintile earnings growth is +22%. Raising the $261 by 22% would raise EPS to $318. Our fair values would shift to $11,000 optimism and $6,400 pessimism.
- Finally, we should recognize that earnings grow over time due to real GDP growth, inflation, operating leverage, and financial leverage. Bloomberg consensus has EPS growing by 11% to $290. As (if) this growth crystalizes, our fair values drift up to $10,000 optimism and $5,800 pessimism as those earnings come through over the next year.
Interest rates are the other critical input to valuations, impacting corporate cost of capital and investor opportunity cost from owning stocks instead of bonds or cash. Returning to our base case of trailing S&P 500 earnings ($261), we can now solve for various fair values based on different interest rate inputs.
- At Hudson Bay, we generally believe that bond yields will be limited by federal government intervention in the bond market — either directly or indirectly. One scenario for rates is to look at the OTC swap market for financing rather than the bond market itself. On this basis, 30-year term SOFR interest rates are currently 3.8%. All else equal, reducing our interest rate input from 4.7% to 3.8% would lift fair values to $13,100 optimism and $6,400 pessimism.
- Of course, we could be wrong. If interest rates were to jump to 7%, our fair value estimate will fall to $5,000 optimism and $3,600 pessimism.
This sensitivity analysis leaves us far more attune to the level of interest rates, which move quickly and themselves reflect volatile market sentiment, rather than the level of EPS growth which tends to be stickier and slower moving outside of a crisis. Interest rates may ultimately be the Achilles heel in extending our valuation analysis to a bullish market outlook. It would be highly unusual for the economy, markets, and investors to experience such a bullish degree of ‘optimism’ without causing a large rise in interest rates as optimistic investors rotate away from bonds and optimistic companies issue low-rate debt to fund optimistic growth outlooks. We take comfort in well-behaved interest rates thus far into the optimism cycle but remain alert to the risk of higher rates in the future counteracting otherwise optimistic upside.
The other consideration in terms of sensitivity analysis is that our estimates of the sentiment spread across both optimism and pessimism are defined as medians over multi-year windows. Within those multi-year windows, the spread itself obviously spent time both higher and lower. Thinking through highly unlikely analytic corner cases, we find:
- $24,000 as an ultra-optimistic fair value based on lower bond yields (3.8%), strong EPS delivery (+22% to $318) and an 80th percentile reading of the sentiment spread during the previously defined period of optimism (+250bp).
- $2,300 as an ultra-pessimistic fair value based on higher bond yields (7.0%), weaker EPS delivery (-12% to 230) and an 20th percentile reading of the sentiment spread during the previously defined period of pessimism (-280bp).
- While these levels present an extremely wide range, they also highlight the inherent option value of being long equites, which cannot go below zero (-100%) but could plausibly reach multipes of their current level ($24,000 is 3.6-times the current $6,700 index level).
Critics of this approach will note that the range of potential fair values is extremely wide and therefore not useful in practice. There is merit to this argument, and we agree that “fair value” can cover an extremely wide range. That said, the wide range informs our own humility as to what constitutes “correct” valuation. Ultimately, valuation matters, and is a useful guide to “what’s priced in.” However, taking directional views based on valuation alone only makes sense in extremes. Today’s prices do not appear to us sufficiently extreme to justify a position (bullish or bearish) on valuation alone.
VI). Options Market Under-Estimates Odds of Optimism
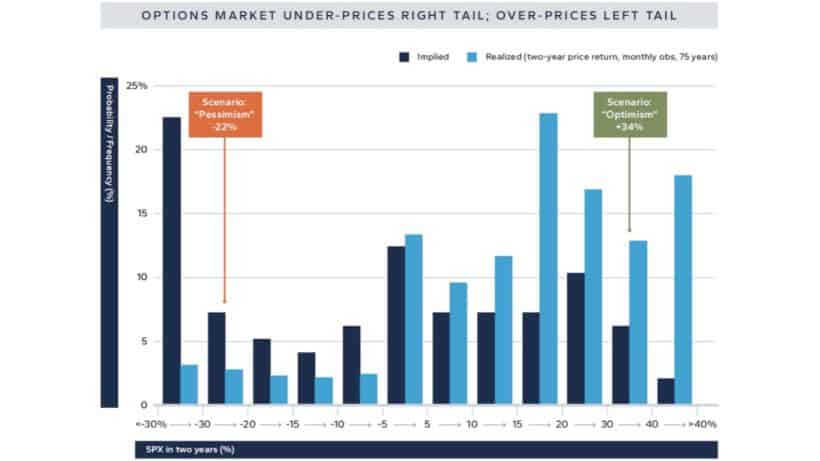
So far, we’ve constrained our analysis to linear space, attempting to determine various fair value scenarios for US equities beyond a simple mean-reverting P/E ratio. The options market has a lot of value to add, however. Returning to our current fair values of $9,000 in “optimism” and $5,200 in “pessimism”, we can price options to determine the option markets’ implied probability of the two outcomes. Specifically, we price binary options maturing in two years — paying out $0 if the condition is not met or $100 if the condition is met. Based on the pricing of these binary options, we find the market is pricing an 8% chance of optimism (stocks > $9,000 in two years) and an 24% chance of pessimism (stocks < $5,200)13.In other words, the derivatives market is pricing “pessimism” roughly three times more likely than “optimism.” This seems wrong to us. Fundamentally, perhaps other investors in the market are over-pricing the probability of disruptive politics (raising the risk premium) or underpricing the probability of AI-driven productivity growth and therefore under-calibrating long-term growth expectations).
Right-tail is cheap: the market prices ~8% odds of 9,000 in two years, underpricing the possibility of an ‘optimism’ regime.
Beyond our fundamental disagreement with market narrative, priced probabilities are less symmetric than the linear scenarios in this analysis. The primary driver for this divergence is “skew,” by which we mean the equity option market’s propensity to over-price hedging insurance (puts) and underprice upside right-tail upside (calls). While equity skew is not unusual, it does create opportunities in the context of our scenario-based valuation work. Skew exists for at least two reasons.
- First, global investors own about $80 trillion worth of equities. These investors naturally have more appetite to hedge existing risks than adding risk on top of existing positions. Similarly, most bank proprietary desks and other fast-money investors are risk-managed in frameworks that punish equity losses. This supply/ demand imbalance tends to keep puts expensive relative to calls, creating a risk premium for us and others to capture.
- The second reason skew exists is the conventional market wisdom that “stocks go up the escalator (slowly) and down the elevator (quickly).” On a day-to-day basis, there is some evidence, but not nearly enough to justify the degree of skew in the market. Looking back over the past twenty years, S&P 500 realizes 18% volatility on days when it is positive and 21% on days when it is negative. While this provides some evidence of the escalator/elevator approach, the market prices faster elevators (expensive puts) and slower escalators (cheap calls) than appear warranted. One year 110% calls were priced at 17% implied vol at time of writing, about 1% below historic realized on positive days. One year 90% puts were priced at a 22% implied volatility at time of writing, about 1% above historic realized on negative days. On a longer-term basis, we find that stocks tend to rise, which makes sense if one believes in an equity risk premium to be captured and positive nominal earnings growth through time.
The chart below compares the frequency of historic two-year returns (dark blue bars) with the priced probability of two-year returns (light blue bars). The right side of this distribution (equity upside) looks inexpensive relative to both history and our “optimism” scenario.
VII). Conclusions
In this paper, we’ve documented our view that US stocks aren’t valuation constrained, despite a P/E multiple on the high side of its historic range. We define a “sentiment spread” as the long-term growth rate (higher being good for equities) minus the equity risk premium (higher being bad for equities). Applying an optimistic sentiment spread, consistent with 1985-2001, justifies considerable further equity upside, assuming current levels of earnings and interest rates. The range of sensible fair values is wide, and current prices don’t appear extreme enough to justify taking positions either way based on valuation alone.
On our analysis, market prices lean toward pessimism in linear space: 34% upside to optimism scenario vs 22% downside to pessimism scenario. Derivative distributions points to the market thinking pessimism is significantly more likely than optimism. At Hudson Bay, we will continue to challenge consensus, place meaningful weight on optimistic outcomes, and suggest other market participants will eventually do the same.
Article by Jason Cuttler, Hudson Bay Senior Markets and Derivatives Strategist, Hudson Bay Capital
View the full white paper in PDF format below
Hudson_Bay_Research_-_Stock_Valuations_Analysis_-_November_2025
About Jason Cuttler, Hudson Bay Senior Markets and Derivatives Strategist
Jason Cuttler is a Senior Markets and Derivatives Strategist at Hudson Bay Capital helping identify derivative investment opportunities for the Chief Investment Officer’s portfolio. He also works closely with other portfolio managers across the firm on episodic market situations. Prior to joining Hudson Bay in November 2020, Mr. Cuttler spent close to 20 years at investment banks, having worked at Goldman Sachs, JP Morgan and Citibank in both London and New York. Mr. Cuttler began his career in 2001 at Goldman Sachs as a single stock equity analyst, migrating into equity derivatives research, portfolio strategy, and most recently equity and macro derivative structuring. Mr. Cuttler graduated with honors from Columbia University with a BA in Economics / Political Science and is a Chartered Financial Analyst.
About Hudson Bay Capital
Hudson Bay Capital is an alternative asset manager delivering absolute return alpha across asset classes and regions, including the Flagship multi-strategy fund. Hudson Bay’s Holistic Investing approach emphasizes independent thinking, including considering a wide range of analyses and insights. The following piece seeks to identify compelling investment opportunities and share macro insights, designed to complement and inform our absolute return strategy. It does not necessarily reflect the view of Hudson Bay Capital and is subject to change at any time.

