
Alarms are being raised around investment-grade BBB rated debt, but they’re oversimplifications. These charts help tell the story.
Q3 hedge fund letters, conference, scoops etc
Investors rely on investment-grade bonds to provide return that’s potentially higher than less-risky government bonds, but likely not as aggressive as riskier high-yield bonds. In the investment-grade bond universe, there’s a range of ratings from AAA (the highest) to BBB (the lowest). BBB sits just above high-yield bonds on the risk spectrum.
The growth in the size of the BBB rated debt market has outpaced the growth in both total investment-grade corporate debt and the high-yield market.
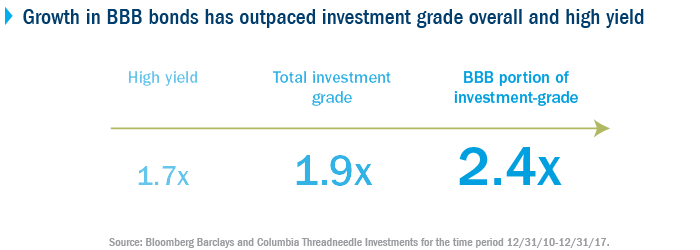
This is making many professional investors nervous: they’re worried an economic slowdown could make it harder for companies to pay off their debt, and BBB bonds could be downgraded to high yield. But it’s oversimplifying matters to make a decision based only on the size of the BBB market. The following three charts demonstrate why.
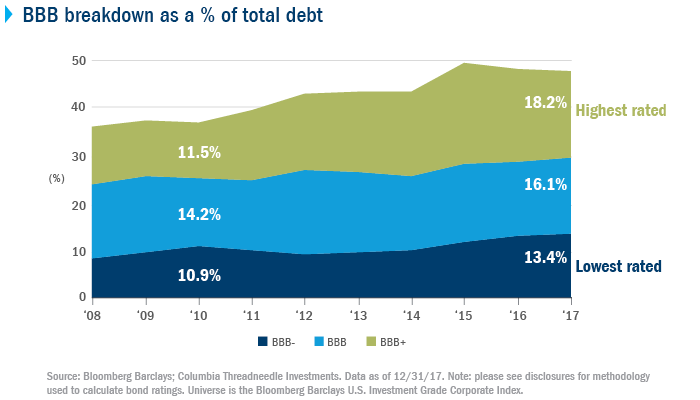
1. The highest rated BBB bond category has grown the most.
The BBB category captures a large range of credit risk profiles including BBB+, BBB and BBB- ratings. BBB isn’t a special class of risk, but simply a grouping of three categories along the ratings progression. BBB+ is at the upper end of the risk spectrum, just one notch below single A- and three notches above high yield. BBB- is on the riskier edge of the spectrum, one notch above high yield. This difference in relative rating is particularly important because more than half of the growth in the BBB portion of the market has come from the highest rated BBB+ space.
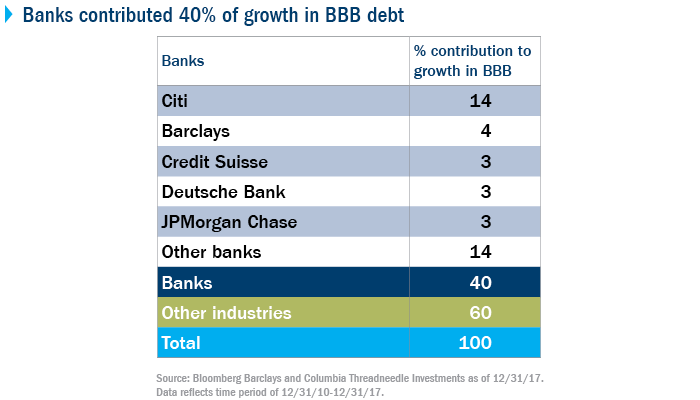
2. Banks have contributed 40% of growth in size of BBB market.
Banking issuers, which were largely AA or A rated prior to the 2008 financial crisis and then downgraded, have driven 40% of the growth in BBB debt in the time period from December 2010 to December 2017. Despite being lower rated than before the financial crisis, banks are now better capitalized, have stronger liquidity and funding profiles, and are subject to more ongoing regulatory oversight than they were before.
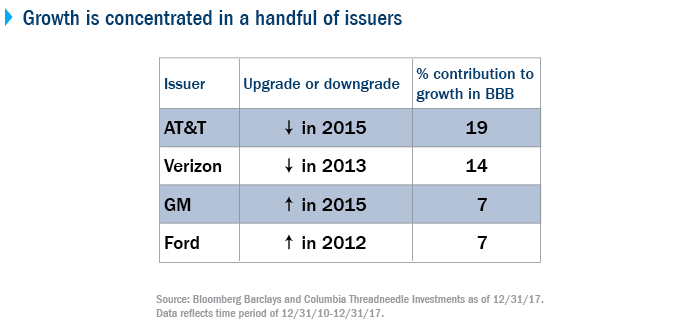
3. Four non-financial issuers represent half of the increase in the size of the BBB debt market
Outside of banks, several individual issuers have driven much of the growth in the size of the BBB market. Telecom companies AT&T and Verizon contributed 19% and 14%, respectively. AT&T was A rated until 2015, when its debt burden grew when it acquired DirectTV and Time Warner. Verizon was A rated until 2013, but then the firm doubled its debt when it purchased Vodafone’s stake in Verizon Wireless. Both firms are currently in the midst of reducing their debt levels, albeit at a slower rate than originally promised.
Interestingly, two automotive companies — General Motors and Ford — historically had higher quality ratings and were downgraded to high yield for the first and only (time to date) in 2005. Their upgrades back to investment grade contributed 7% each to the growth in BBB debt outstanding.
Bottom line
The growth of the size of BBB rated debt outstanding is not simply a broad-based symptom of a suffering investment-grade market. The higher rated BBB+ section has grown the most, and over 90% of the growth has come from banking and a handful of issuers. We don’t think the amount of BBB rated debt is cause for immediate alarm. Active management of fixed-income investments can help avoid the bad actors and focus on issuers that have the balance-sheet strength to withstand a potential economic downturn.
Article by Tim Doubek, Columbia Threadneedle Investments

