
Oxford Square Capital Corp (OXSQ) offers a big 14.8% yield, but you need to be a brave contrarian if you’re going to invest. This business development company (BDC) invests in syndicated bank loans and both equity and debt tranches of collateralized loan obligations (CLO); and the shares have been dragged sharply lower because of its exposure to underperforming market segments including healthcare, software and high yield credit in general. This article provides a background on the company, analyzes its portfolio and finally concludes with our reasoning for ranking it No. 9 on our recent list of Top 10 Safe 8% Yields (low-beta edition).
Q3 2019 hedge fund letters, conferences and more
Note: this article was originally released to Blue Harbinger members-only on Nov 22 when the yield was 15.5%. The yield has since come down to 14.8% (because the share price has risen), but remains extremely attractive on a risk-reward basis, in our view.
Overview:
Oxford Square Capital Corp was founded in 2003 and operates as a closed ended, non-diversified investment management company with a portfolio of $398 million invested in debt of individual companies and CLOs.
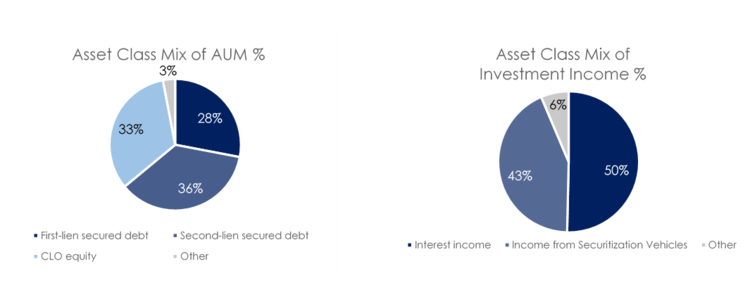
The company’s investment portfolio primarily includes first lien secured debt (27%), second lien secured debt (39%) and CLO equity (33%). From an industry perspective, the company’s key exposures are in business services, software and healthcare amounting to 24%, 23%, & 21% respectively of the total portfolio value as on 30th September 2019.
What Is A Business Development Company (BDC)?
A typical business development company is a closed end investment company that invests in privately owned, middle market companies, providing them capital to grow or recapitalize.
What Are the Advantages of Investing via a BDC?
- High dividend yield as BDCs are required to distribute 90% of their profits to shareholders as per the governing law.
- Being a regulated investment company, a BDC is not required to pay corporate income tax on profits.
- They offer diversification as the portfolio consists of companies belonging to varied industries.
- Experienced Investment management teams
- Fair amount of liquidity and transparency as BDCs are traded on public exchanges, unlike venture capital funds which are privately placed.
- As they are traded on stock exchanges, period of volatility can lead to shares of BDCs trading at attractive discounts to NAVs.
Oxford Square Capital Corp’s Business Model
The company primarily invests in corporate debt securities and collateralized loan obligation vehicles (CLOs) that own corporate debt securities. CLOs typically own lower than investment grade corporate loans collateralized through a special purpose vehicle where the investor receives debt repayments and interests. These CLOs are divided into tranches (various risk levels of debt and equity). Equity tranche is considered to be the lowest tranche in the hierarchy and bears the highest risk as they are paid after the debt tranches. Having said that they also provide a higher potential return in a normal environment. The company generates 50% of its income from investment in debt securities and 43% income from investment in equity tranche of CLOs even though CLOs account for 33% of assets due to the higher yielding (but with more volatility) income stream on CLO equity tranches.
Source: Oxford Square Capital Corp & Blue Harbinger Research
Shares dragged lower by asset allocation exposures
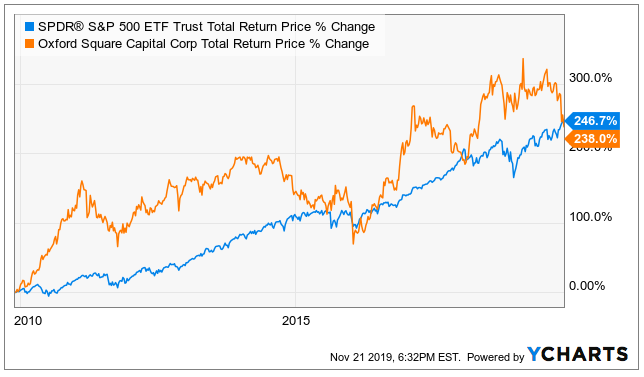
The company’s share price has been dragged lower by management’s tactical asset allocation decisions (for example, the company has heavy exposure to underperforming asset classes of healthcare, software and high yield). For starters, here is a look at the year-to-date total returns (dividends plus price appreciation of OXSQ versus the S&P 500).

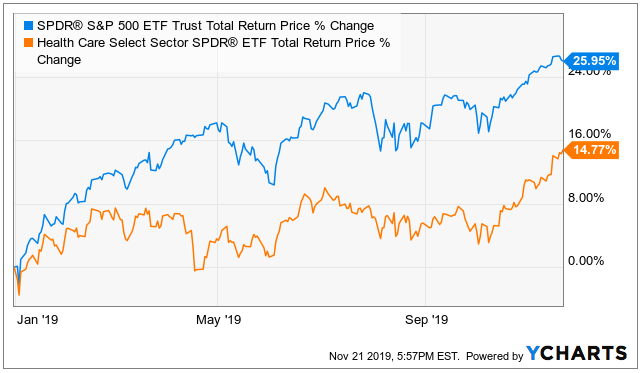
One of the reasons for the underperformance is the company’s heavy exposure to the healthcare sector. This sector has struggled this year, as evidenced by the following chart comparing the healthcare sector (XLV) to the S&P 500 (SPY). And while this can be discouraging to some investors, many contrarians view it as a potential buying opportunity.
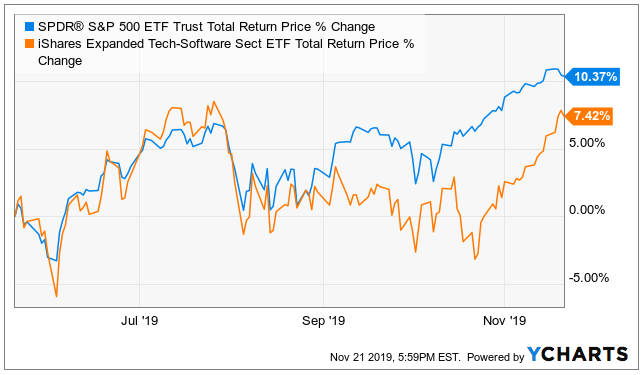
Adding to the underperformance (and also adding to contrarian investor excitement), the company has heavy exposure to the software sector, which had been struggling during the second half of this year, as shown in the following chart. Important to note, this sector has been improving significantly in recent weeks, but that wouldn’t yet be reported in Oxford Square’s most recent quarterly numbers (as of Sept-30), and it’s arguably not yet reflected in the OXSQ share price because OXSQ’s business model is difficult for many investors to wrap their arms around.
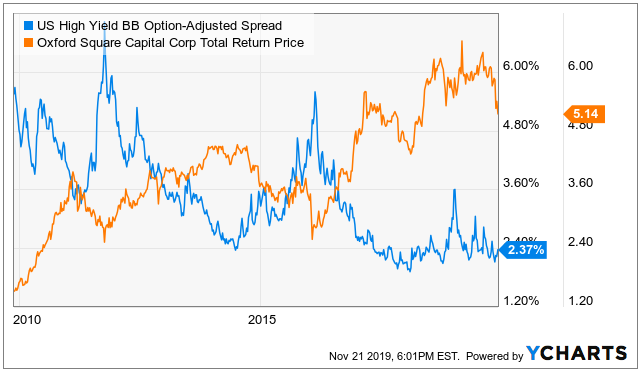
Also adding to the sell off (and the attractive contrarian opportunity), high yield bonds in general have been dragged indiscriminately lower by the struggling energy sector. OXSQ is impacted negatively by increased volatility in high yield credit spreads, as shown in this next chart, even though OXSQ is not in the energy sector (i.e. OXSQ has been inappropriately dragged lower simply because of its high yield exposure). And as you can see in this next chart, high yield spreads have been volatile this year at a level not seen since 2015-2016.
Management selected these challenging allocations
Since its founding in 2003, the company has displayed a shifting portfolio strategy. The company was founded by an equity research professional covering the tech industry and not surprisingly it was set up to take debt positions in tech-oriented companies initially. The language from 10-k below highlights the major changes in the company’s mission statement since its IPO.
“Our investment objective is to maximize our portfolio's total return, principally by investing in the debt and/or equity securities of technology-related companies” – 2003 10-K
“While we continue to maintain our primary focus on the technology sector, we expect to actively seek new investment opportunities outside this sector that otherwise meet our investment criteria” – 2008 10-K
“The structures of our investments will vary and we seek to invest across a wide range of different industries” – 2018 10-k
The company’s asset class mix has also seen a significant shift with CLOs gaining prominence at the expense of Senior Secured Notes. From nil exposure to CLOs in 2006, today roughly 30% of the company’s assets are in CLOs.
Management is directly responsible for the allocations that have dragged the share price lower. However, it’s important to note that the company has also undertaken buybacks in the recent quarters funded by debt. This is an indicatin by management that they believe the shares are undervalues, and have upside ahead.

Source: Oxford Square Capital Corp.
Nonetheless, the charts below show the mixed track record of the company over a long period and across cycles. Cleary, they took a hit to NAV and NII following the credit market challenges related to the financial crisis of 2008 - 2009.

Source: Oxford Square Capital Corp. & Blue Harbinger Research
However, note from the following chart, the 10-year total return has kept pace with the overall market (S&P 500), albeit with more volatility and a much bigger dividend yield. To us, this is an indication that management has the ability to drive successful total returns for investors. And now may be an attractive time to invest from a contrarian standpoint.
Recent market turbulence compounds the issues
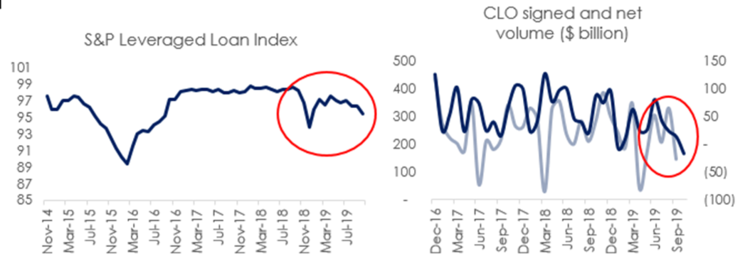
Since Q4 of 2018, the CLO market has exhibited heightened volatility. There has been a bifurcation in trends with the performance gap between quality and junk status instruments broadening. CLO managers are supposed to test their underlying portfolio for interest and value coverage and any shortfalls in the higher tranches such as AAA are compensated by lower traches such as CLO equity and lowest debt tranches. Nearly all of Oxford’s CLO exposure is from equities, making it particularly susceptible to increased volatility in CLO markets.
Source: Oxford Square Capital Corp. & Blue Harbinger Research
Recent performance has been impacted by CLO issues
In Q3 2019, the company reported an 18% increase in stated interest income on YTD basis. However, income from CLOs has been going down significantly over the last few quarters. It has decreased from $7.2 million in Q3 18 to $6.1 million in Q3 this year which is a decline of more than 15%.

Source: Blue Harbinger Research
Finally, the fair value of CLO investments has also come down in the past few quarters and the value of the CLO portfolio is now less than 75% of their actual cost. In the recent conference call, the management explained that there has been a widening of the spread differential between higher quality & lower quality loans. This spread has reached its widest level since 2017. The chart on the next page shows how realized and unrealized losses have eroded the company’s NAV per share over the last few quarters.

Source: Oxford Square Capital Corp. & Blue Harbinger Research
Attractive yield, but underlying investments need a rebound
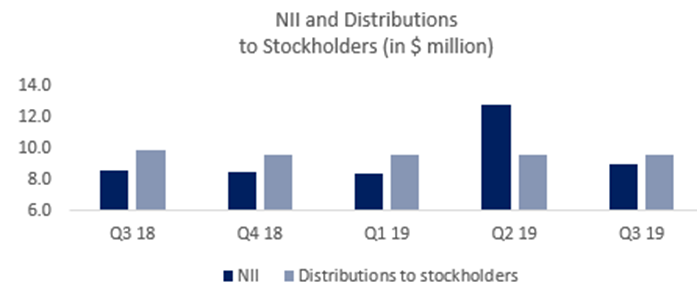
The company has been consistently paying more in distributions than it earns as investment income. Additionally, the company has also undertaken buybacks in the recent quarters funded by debt. In the past, the company has said that it considers various other factors other than NII to decide on its dividend policy however if the NAV per share and NII both are going south, and OXSQ needs a price rebound (whether realized or unrealized) in its underlying assets to give the market more confidence. Without a rebound in the investment allocations management has selected (i.e. software, healthcare and high yield) the sustainability of the current dividend is uncertain.
Source: Oxford Square Capital Corp. & Blue Harbinger Research
Significant Upside Potential… Recovery in CLO space, healthcare, software
A recovery in the CLO market as well as junk bonds in general could lead to improved NAVs via realized or unrealized gains in the portfolio. Remember also, there is a high correlation between the high yield credit market and the currently struggling energy sector; OXSQ’s high yield assets have been marked lower regardless of the fact that OXSQ is not an energy company. Further, a rebound in the underperforming healthcare sector could help OXSQ shares. And a continuing rebound in the software sector likely will help OXSQ when it shows up on the books when it reports future earnings, ceterus paribus. The company absolutely faces risks, but it has a healthy long-term track record of total returns (dividends plus price appreciation), and there are currently multiple reasons for contrarian income-focused investors to consider investing.
Conclusion
If you are looking for the safest yield in the world, Oxford Square is absolutely not for you. And if you are looking for purely share price appreciation (without focusing on total returns… share price plus dividends), then Oxford Square is also not for you. However, if you are a contrarian income-focused investor looking to fill an “opportunistic” slot in your prudently diversified portfolio, Oxford Square is worth considering. The shares have sold off significantly in recent months, and the saying is to “buy when there is blood in the streets.” Things could get worse before they get better, but if credit spreads settle down (like they always eventually do) and if healthcare and software rebound (like mean reversionists claim they empirically almost always do), then Oxford Square will have some very powerful tailwinds at its back, as well as a management team that has delivered impressive (albeit volatile) total returns (dividends plus price appreciation) over the long-term.
We are long Oxford Square within an “opportunistic high income” slot, within our prudently diversified, goal-focused, long-term, Income Equity portfolio. Of course, we’re not always right, and we make mistakes, but in aggregate our impressive long-term track record of market-beating income and capital appreciation continues to grow. And for the record, not everything we own in this portfolio is “opportunistic.” We also own and/or write about “steady high income” opportunities too. You can learn more here.
Article by Blue Harbinger

