Marram Investment Management's commentary for the fourth quarter ended December 31, 2025.
Dear Investors,
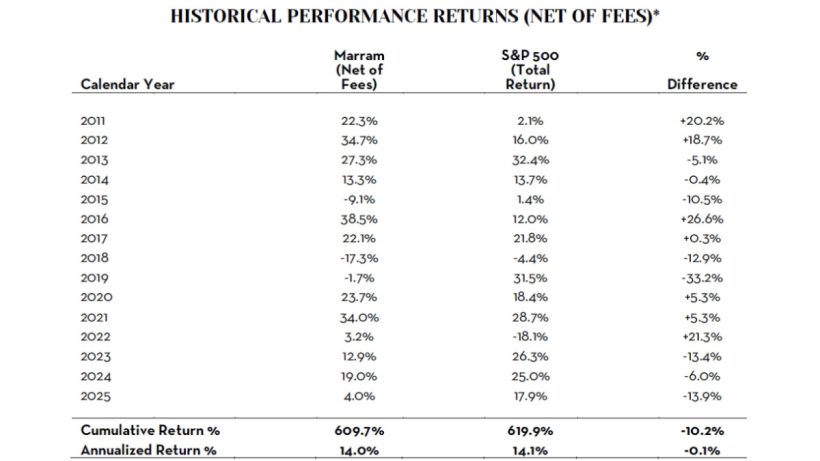
The Portfolio* appreciated +4.0% (net of fees) in 2025.
Since inception, Marram has generated +609.7% cumulative return and +14.0% annualized return, net of fees.
For monthly details, see Historical Performance Returns* at the end of this letter. Also, please refer to your separate account statement for exact account return figures.

About Marram
Marram is an outsourced long-term investment solution, focused on growing wealth for retirement or legacy purposes. We began as a service for a small circle of friends and family. Our investor-friendly fee structure (lower than hedge funds), terms (separate accounts, no lock-up), and high standards of care and excellence, reflect those origins. Our portfolio manager has the majority of her family’s liquid net worth invested in the same strategy – we eat our own cooking – ensuring that we shepherd your investment with the utmost care, as we would our own.

Portfolio Allocations
Below is the target portfolio allocation – the optimal allocation as of the writing of this letter. Investor separate accounts may differ from this allocation due to changes in asset prices, availability to acquire/divest securities in the marketplace, margin & trading capabilities, and tax considerations. Over time, all investor separate accounts converge upon the target portfolio allocation.
- Energy Infrastructure / Master Limited Partnerships (MLPs): 24% NAV
Energy infrastructure companies with assets indispensable to the smooth function of modern society. These investments were made in early 2020, taking advantage of commodity price volatility, shareholder turnover, forced selling, and uncertainty related to the long-term demand of fossil fuels which drove prices to extremely low levels. Since then, geopolitical strife, inflation, and increased recognition of the limitations of renewable energy have led market participants to reembrace fossil fuels, which in turn has lifted the prices of our MLPs. The size of this allocation peaked at 42% of NAV in late-2021, and has gradually declined due to harvested gains, trimmed exposures, and M&A activity. MLPs remain a cornerstone of our portfolio given favorable industry demand dynamics, stable cash flows, conservative balance sheets, reasonable valuations (at ~10x Cash Flow), generous cash distributions, and inflation protection. See our 2019 4th Quarter and 2021 2nd Quarter Letters for our MLP investment thesis.
- Large-Cap Financials: 17% NAV
In March 2023, during the brief U.S. banking crisis, the prices of large regional banks fell precipitously as investors indiscriminately sold shares, allowing us to significantly increase our exposure at fire-sale prices. Since then, our regional bank investments have increased significantly in value since then, returning on average 30%+ IRR. While we continue to view the sector favorably over the long term given its ability to generate steady profits of ~10%+ annually, unrealized securities losses have reversed, valuations have expanded, and we are observing a gradual easing in credit underwriting standards across the industry. Therefore, we prudently moderated our exposure over the past 18 months, exiting some investments earlier than originally intend. See our 2023 1st Quarter Letter for our Regional Bank investment thesis.
- Payment Technology: 15% NAV
Growing payment technology businesses with favorable revenue tail winds, generating cash profits, actively reinvesting profits back into the business at high incremental margins, and selffunding future growth with little/no equity dilution. We purchased these investments at attractive prices that will generate at least 3X return in 5 years based on reasonable topline growth & margin assumptions. See our 2022 1st Quarter Letter for more details.
- Biopharma & Other: 9% NAV
The biopharma sector has been out of favor, weighed down by political and other factors that have led to lower industry $ R&D spend. Taking a long-term view, we believe society will continue to need (and demand) new drugs and other health innovations (obesity treatments, nextgeneration vaccines & therapeutics, medical/diagnostic devices, and cosmetic enhancements, etc.), all of which requires data collection, rigorous testing, and regulatory validation prior to mass market rollout. With time, we believe capital will return to the sector and industry $ R&D spend will reaccelerate. We initiated a diversified basket allocation via ETFs and service-based businesses (data generation/collection, clinical trial design/implementation, and regulatory navigation). This allows us to benefit from recovery of industry $ R&D spend from cyclical lows while minimizing adverse exposure tied to individual drug development outcomes.
- Cash & Cash Equivalents: 35% NAV
This category will fluctuate depending on investment opportunities available in the marketplace. We collect ~4% interest and dividends per year which continuously replenishes our cash balance.

Portfolio Return* Analysis & Future Positioning
The Portfolio* returned +4.0% (net) in 2025.
While this result was modest, it reflects a year in which the market prices of certain investments diverged meaningfully from business performance. As always, we measure progress not by short-term market fluctuations, but by the long-term profit metrics of the businesses we own.
During the year, Large Financials, MLP Energy Infrastructure, and Biopharma contributed positively to results. Our Payment Technology holdings reduced returns by approximately 4% despite continued growth in per-share profits.
Since our last update, we made the following portfolio adjustments:
- Large Financials. We continued to harvest gains by trimming Fifth Third (FITB) to 6% NAV. While we remain constructive on the sector’s ability to steadily generate 10%+ earnings yield, valuations have expanded, and credit underwriting standards are gradually easing. Therefore, over the past 18 months, we have prudently moderated our exposure to regional banks.
- MLP Energy Infrastructure. During a brief sector pullback in October, we initiated a new investment in Oneok (OKE), 3% NAV at ~$71/share (11% cash-on-cash yield). We also increased our investment in Plains All American (PAA/PAGP) to 6% NAV at ~$16/share (15% cash-on-cash yield). MLPs continue to generate durable cash flows supported by long-lived assets with inflation protection and disciplined capital allocation.
- Payment Technology. We rebalanced this allocation by exiting positions in billing digitalization (AVDX and BILL), trimming Paysafe (PSFE), and reallocating capital into higher-conviction holdings — PayPal (PYPL) to 4% NAV, Shift4 (FOUR) to 3% NAV, and Paymentus (PAY) to 3.5% NAV — at lower prices.
Payment Technology: Market Price vs. Fundamentals
The payment technology sector is currently experiencing a disconnect between operating fundamentals and share price performance. Investor fear of near-term growth deceleration has resulted in valuation compression and shareholder turnover, even as these businesses continue to compound value on a per-share basis. To illustrate this divergence, below we summarize recent operating progress alongside market performance for the three names mentioned above.
PayPal (PYPL), over the past 3 years:
- Revenue per share increased +42%, or +12% annualized.
- Free Cash Flow per share increased +54%, or +15% annualized.
- Share Price declined -37% over the past year.
PayPal, a virtual payment tool, was created to support the fledging ecommerce sector in the 1990s. It was built during the Internet Boom by a list of now-familiar Silicon Valley personalities1: Peter Thiel, Elon Musk, Max Levchin, David Sacks, and Reid Hoffman. eBay acquired it in 2002 and spun it out in 2015. From 2013-2023, the previous CEO binged on acquisitions (but failed to integrate them) while neglecting to reinvest and build new products to retain and attract customers. This left a gap in the competitive landscape quickly filled by a new generation of competitors (ApplePay, Stripe, Shopify, Adyen, Block, etc.)
A new CEO and management team was installed in December 2023. Since then, efforts have been directed toward reinvigorating the brand, building new products, simplifying the organization by (finally) integrating acquisitions, and eliminating redundancy bloat. Improved efficiency has allowed the company to ramp investment into new product innovations and cross-product integrations, while maintaining strong margins, and returning substantial capital to investors through share repurchases.
While certain segments are mature with stagnating growth (Branded Checkout Button, Braintree), other segments are growing rapidly (Venmo, BNPL), and a few early initiatives (Agentic and stablecoin commerce) have potential to meaningfully expand PayPal’s role in digital commerce in future years and to turbocharge growth.
PYPL trades at an undemanding valuation of 10% free cash flow yield. Even under conservative assumptions that $ free cash flow (numerator) growth slows to <5% per year, when combined with a steadily declining share count (denominator), the $ free cash flow per share will continue growing at 10%+ per year in the medium term, bringing our estimated annualized return to ~20%+ per year.
Shift4 (FOUR), over the past 3 years:
- Revenue per share increased +122%, or +30% annualized.
- Free Cash Flow per share increased +227%, or +48% annualized.
- Share Price declined -45% over the past year.
FOUR’s customers (in fast-growing specialty verticals such as casinos/hotels/resorts, event/sport stadiums, restaurants, airlines, etc.) rely on it for payment software and core integrations required to run their businesses. Revenue and cash flow per share have grown rapidly through a combination of organic product development and well-executed acquisitions. Management intends to repeat this playbook via international expansion. However, the market has expressed concern regarding the wisdom of a recent large acquisition (Global Blue) and is second-guessing management competence, which has resulted in recent share price decline.
There are many examples of substantial value creation by disciplined acquirers who integrate thoughtfully, extract synergies consistently, and allocate capital rationally. (Admittedly, the opposite is true for serial acquirers who do this poorly.) Thus far, FOUR’s management trackrecord has demonstrated superior execution and aptitude for strategy, product innovation, and outmaneuvering competition. The Founder owns 25% of the company, aligning him with shareholders. We are inclined to see how this next phase plays outs.
FOUR currently trades at 6% free cash flow yield. Given its historical ability to take share within the industry verticals they serve, we believe $ free cash flow per share will continue to grow at 15-20%+ per year in the medium term, bringing our estimated annualized return to 20-25%+ per year.
Paymentus (PAY), over the past 3 years:
- Revenue per share increased +85%, or +36% annualized.
- Free Cash Flow per share increased +204%, or +74% annualized.
- Share Price declined -7% over the past year.
Paymentus’ payment software serves non-discretionary end markets such as local municipalities, utilities, telecom, and insurers. Its software enables a smoother bill-payment process by enabling customers to engage via their preferred channel (text, desktop, in-person, etc.) or payment type (autopay, check, cash, ACH, card, digital wallet, etc.). This helps improve bill payment conversion (increased revenue), reduces inbound call volume (decreased cost), and higher customer satisfaction. This software is available via one integration and eliminates the need to maintain multiple systems and vendors. The Founder and CEO owns 24% of the company, providing strong alignment with shareholders.
PAY currently trades at 3% free cash flow yield. Adoption momentum remains robust, and while growth rates will likely moderate from recent exceptional levels, we expect Paymentus to continue growing $ free cash flow per share at 20%+ per year in the medium term, bringing our estimated annualized return to ~23%+ per year.
Our Payment Technology investments should be evaluated over years, as their value compounds gradually through innovation and scale. Built with newer technology and led by forward-thinking management teams, they are steadily taking market share while also benefiting from secular growth in digital transactions and the tailwinds of inflation. Operating leverage (higher $ payment volumes flowing through largely fixed cost structures) and responsible capital allocation means these businesses are positioned to deliver sustained free cash flow per share growth and exceptional upside potential in the years ahead. Periods of market skepticism have historically provided attractive entry points for patient owners, and we believe this remains the case today.
Please do not hesitate to reach out with any questions. As always, thank you for your trust. We look forward to continuing our capital compounding adventures in the years ahead.
Yours very truly,
Vivian Y. Chen, CFA
Portfolio Manager
Marram Investment Management
Read more hedge fund letters here