Crescat Capital's commentary for the month ended July 31, 2025, titled, "America's Twin Deficit Trap."
The US now faces a textbook twin deficit problem: a swollen fiscal shortfall on one side and a trade imbalance on the other. The fiscal deficit is widely discussed, but the trade gap is just as striking — worse than at any point since the 1800s, except briefly during the global financial crisis when GDP collapsed.
Today’s imbalance, by contrast, is structural, not cyclical.
For the first time, the US is running twin deficits while government debt has reached extreme levels, and the dollar stands at one of its most overvalued levels in history. This combination is unsustainable. Something must serve as the outlet for these pressures, and the most likely escape valve is the dollar itself.
So far this year, the US dollar has suffered an extraordinarily steep decline. While many argue the selloff has gone too far, we see it as likely the opening phase of a broader, long-term weakening trend — driven by the growing necessity of financial repression rather than mere policy choice.

Unlike the 19th century, when current account deficits were a reflection of a young nation drawing in British capital to finance its growth, today’s imbalances stem from a mature system stretched by decades of capital inflows and fiscal expansion.
Much of the world’s available capital has already been absorbed by US markets, leaving little room for further inflows. As that reservoir shows signs of exhaustion, the direction of flow may begin to reverse, leaving the US increasingly exposed.
It is also important to stress the magnitude of the debt burden. Even during the Civil War and Reconstruction era, federal debt never exceeded one-third of GDP. Today it is more than three times that level. This scale of obligations leaves few adjustment mechanisms other than the currency.
Echoes of 1971: Nixon’s Dollar Crisis and Today’s Greater Imbalances
Today’s escalating tariffs and trade disputes evoke a familiar period in US economic history. In the late 1960s and early 1970s, the US remained tied to the Bretton Woods system, with the dollar fixed to gold. But heavy spending on the Vietnam War and Johnson’s Great Society programs, combined with a steadily eroding trade advantage, left the nation’s external position severely weakened.
By 1971, confidence in the dollar was collapsing, gold reserves were under relentless pressure from foreign redemption demands, and President Nixon faced a stark choice: defend the peg with painful austerity at home or shift the burden abroad.
He chose the latter.
In August of that year, he suspended the dollar’s convertibility into gold and imposed a 10% surcharge on imports, forcing America’s trading partners to allow their currencies to strengthen.
The yen, the Deutsche mark, and others revalued sharply against the dollar. What began as a single adjustment quickly evolved into a lasting trend: through the 1970s, these currencies continued to strengthen as fundamentals reinforced the shift, and the dollar entered a prolonged era of weakness.
The parallels today are hard to ignore. Nixon’s deficits, considered large at the time, were modest compared with the scale of America’s current challenges. Today’s fiscal and trade imbalances are multiples larger in both absolute and relative terms, while the debt burden has reached levels unimaginable in the 1970s. On top of this, the global financial system is far more interconnected, amplifying the risk of a disorderly adjustment.
In the 1970s, the dollar absorbed the pressure through a sharp initial devaluation followed by years of gradual depreciation against foreign currencies. With today’s disequilibrium far greater, we believe the adjustment ahead is likely to be even more severe. In our view, the issue is no longer whether the dollar weakens, but how far and how fast this could unfold.
More importantly:
Pair what we see as a likely multi-year decline in the US dollar with a 7% fiscal deficit and an AI- and onshoring-driven construction boom, and the outcome is unavoidable in our view: inflation is likely to remain an entrenched and unresolved problem.

The Age of Spenders vs. Earners
The defining feature of the coming market environment will be a profound divide between spenders and earners. This is not a marginal trend but a structural reordering of capital flows. On one side are the entities compelled to spend on a scale rarely seen outside of wartime; on the other are the industries positioned to earn from that tidal wave of investment.
Artificial intelligence has sparked a global technological arms race. Unlike past innovations such as railroads or the internet, where adoption unfolded gradually, AI is driving governments and corporations into an urgent competition to secure infrastructure and capacity first. Compounding this urgency is the parallel push toward onshoring — a reversal of globalization that demands rapid domestic buildouts of factories, datacenters, and supply chains. Together, these forces point toward what could become one of the most extreme construction booms in modern economic history.
This is not a conventional investment cycle. It marks the onset of a new economic order, one driven by necessity rather than choice. In our view, the spenders will fund the transformation, and the earners will likely compound the returns.

The Spenders
The government, weighed down by historic debt levels, cannot realistically bear this burden. Instead, the responsibility falls to mega-cap corporations with fortress balance sheets. The “Magnificent Seven” exemplify this dynamic. Collectively, these companies carry relatively low debt balances and, after accounting for their cash holdings, all together actually sit on positive net cash of roughly $70 billion. With total assets exceeding $2.7 trillion, they possess extraordinary capacity to raise and deploy capital.
It should come as no surprise if, by the end of this decade, these companies have shifted dramatically from net cash positions to carrying substantial leverage. Over the past 5–7 years, they have steadily drawn down cash reserves, and the scale of spending ahead will almost certainly push them to rely heavily on debt financing.
The pressing question, however, is whether current valuations can be sustained as balance sheets deteriorate. The median Magnificent 7 stock is already trading near 50 times annual free cash flow — the highest multiple in history.

Dividends, Buybacks, and the Untapped Trillions
Today, nearly 82% of the Magnificent 7’s free cash flow is funneled into dividends and buybacks. Redirecting even a fraction of that toward capital expenditure would unlock trillions in potential investment. On top of this, they have enormous untapped capacity to issue debt should policymakers demand it. Whether it’s Apple being compelled to onshore manufacturing or Tesla/SpaceX/xAI deploying vast sums into initiatives like Colossus, we believe these companies may be poised to become the defining spenders of this era.
The trade-off is clear: shifting capital from shareholder-friendly policies into transformative projects could compress multiples in the near term. But the reality is undeniable — these companies have many tools at their disposal to finance this wave of investment. And in an AI-driven arms race, necessity will force their hand. Spenders will spend.

The Earners
On the other side of this equation are the industries positioned to benefit directly from this surge in capital expenditure. We see three categories of structural winners:
- Energy – Securing abundant and reliable energy is fundamental to winning the AI race. Natural gas stands out as the most scalable and cost-effective near-term solution, though nuclear will likely grow in importance over the longer term. Coal assets, despite their age, are already experiencing a revival, while solar is emerging as another priority for new investment, positioned to complement the energy mix and expand capacity at scale.
- Infrastructure – Expanding energy capacity demands massive infrastructure upgrades. Pipelines for gas, grids for power distribution, reactors for nuclear energy, solar panel deployment, and retrofitting coal plants will all require substantial investment. Datacenters and factories will accelerate the need to modernize and expand electrical grids on a historic scale.
- Raw Materials – The critical constraint is supply. Decades of underinvestment in mining and materials have left shortages across key commodities. Yet these inputs are indispensable for AI and onshoring alike. From copper, nickel, zinc, silver to iron ore, steel, and cement, raw materials will likely be at the center of this boom. Precious and base metals are poised to benefit not just from cyclical demand, but from structurally improved industry fundamentals.
We believe we are entering an era that will be defined by massive spenders and indispensable earners. The largest corporations will likely be compelled to lever their balance sheets on a scale unseen outside wartime, financing the vast buildout of AI, onshoring, and infrastructure — while energy, infrastructure, and resource producers emerge as the natural earners, their strengthened fundamentals drawing in the next wave of capital.
As we consider how these shifts may unfold, it is essential to account for the role of policymakers — particularly the Federal Reserve and the Trump administration — over the coming months, given the heightened tension and policy divergence between the two.
Lessons from LBJ to Trump: The Fed, the President, and the Battle Over Inflation
We often treat today’s events as if they were without precedent, but the clash between Fed Chair Jerome Powell and President Donald Trump is hardly unique. History offers plenty of echoes, and one episode in particular provides a striking roadmap for what could lie ahead.
In December 1965, the US witnessed one of the most dramatic confrontations in the history of central banking. President Lyndon B. Johnson, fresh off a landslide victory and determined to push through his “Great Society” programs while escalating the war in Vietnam, was driving a surge in federal spending. The atmosphere was charged: growth was brisk, but inflationary pressures were starting to show.
At the center of it all was William McChesney Martin Jr., the long-serving chairman of the Federal Reserve. Martin, first appointed by Truman and then reappointed by both parties, was respected for his independence. He believed the economy was “overheating” thanks to a combination of war spending, social outlays, and a 1964 tax cut. In early December, the Fed narrowly voted to raise the discount rate for the first time in five years, from 4% to 4.5%.
President Johnson saw this as a direct threat. Still recovering from gallbladder surgery, he summoned Martin to his Texas ranch. In a meeting that has since become legendary, Johnson berated and even physically shoved the Fed chair around his living room, accusing him of betrayal:
“You’ve got me in a position where you can run a rapier into me, and you’ve done it. My boys are dying in Vietnam, and you won’t print the money I need!”
Johnson, used to bending opponents to his will, demanded loyalty. Martin, shaken but firm, stood his ground. “The Federal Reserve Act placed responsibility for interest rates with the Board,” he replied. “On this, the decision has to be final.” Johnson backed down. The rate hike stood, and with it a critical precedent for Fed independence.
The fiscal backdrop is also worth recalling. In 1965 and 1966, the federal deficit was tiny by today’s standards — just 0.2% of GDP in 1965. But that restraint didn’t last. War costs and welfare programs soon swelled the deficit, and inflation followed.
The longer price pressures were allowed to linger, the more deeply they embedded in the economy. By the 1970s, inflation had spiraled out of control, fueled in part by political pressure to prioritize growth over stability. Yet even that deterioration pales in comparison to today’s fiscal landscape, with deficits running close to 7% of GDP before a recession has even set in.
That episode underscores the danger of short-term politics overwhelming long-term monetary discipline. And the parallels to today are hard to ignore. Inflation has been re-accelerating, while Trump openly presses Powell to cut rates in order to relieve the burden of mounting federal debt.
Now, from a market standpoint, the dollar appears to be standing on a decade-long line in the sand.
It is worth noting that the DXY index is still hovering just above a decade-long support line. A decisive break below that threshold could trigger the broader dynamics we’ve outlined. Notably, both the euro and the British pound have already broken through comparable long-term trend levels, suggesting they may be leading indicators of what lies ahead for the index as a whole.
What’s interesting is that many macro-sensitive assets — emerging markets, smaller resource companies, and others — seem to be waiting for this potential breakdown to unlock upside momentum.
A confirmed breakdown in the dollar could catalyze a wave of macro trends that have been building quietly in the background. Hard assets have shown notable resilience through this phase, and I suspect that strength is structural — not temporary.
We may be entering a pivotal moment. Exciting times ahead, in our view.

The Unavoidable Trade-Off: Fiscal Dominance vs. Inflation Control
This time, one could argue that both sides have a case. Powell is right to worry about inflation, while Trump has reason to seek relief from soaring interest costs.
However, the reality is that fiscal dominance is becoming unavoidable. The US is approaching a point where rate suppression will be the only option, even if it means tolerating higher inflation.
Even without interest payments, the US is still running a deficit of around 4% of GDP — an extraordinary imbalance. Cutting rates may buy time, but unless spending is reined in, the fiscal math only gets worse. Mandatory outlays are difficult to reduce without radical reform, so the adjustment is likely to come at the expense of growth-oriented initiatives.
From Powell’s perspective, the picture is equally challenging. The Taylor Rule, which offers a guide for setting interest rates based on inflation and output, suggests that rates should be roughly 150 basis points higher than where they stand today.
Yet Treasury Secretary Scott Bessent recently argued that rates should be 150 basis points lower than they are — a gap of 300 basis points from the Taylor Rule.
Trump, for his part, wants rates at 1%. If that happened, it could be nirvana for hard-asset investors, but it would also all but guarantee that inflation continues to pulse through the system.
The recent narrative has been dominated by the re-emergence of inflationary pressures. The central question at present is whether the latest data represents a transitory outlier or the early indication of a sustained resurgence in consumer prices.
To illustrate this, consider the relationship between the ISM Services PMI Prices index and Core CPI. Historically, movements in the former tend to precede shifts in the latter by approximately 12 months. If this historical relationship persists, it suggests that inflation is on the verge of re-acceleration.

The Unfinished Battle Against Inflation
It is noteworthy that some observers contend inflationary pressures are abating. However, the equal-weighted commodities index has risen approximately 12% over the past year, reflecting tangible price pressures in the real economy.

The Monetary Engine Behind Inflation
Additionally, money supply has recently reached record levels. It is important to recall that inflation is, at its core, a monetary phenomenon. Sustained credit expansion combined with persistent fiscal deficits — currently around 7% of GDP annually — makes it highly improbable that inflationary pressures can be resolved under such conditions.

Capitalizing on Fiscal Dominance: Gold, Metals, and Miners
With inflation re-accelerating and fiscal dominance appearing to be increasingly unavoidable, the case for gold, other metals, and mining companies comes sharply into focus. In our view, these assets represent one of the clearest ways to capitalize on the profound imbalances in the global economy and the war-like arms race now unfolding in infrastructure investment driven by AI and onshoring.
After two years of strong gains in gold prices, investors are beginning to move further up the risk curve, allocating capital to mining companies and other metals. Notably, gold miners are outperforming every sector of the S&P 500 this year — a trend that, in our view, is likely still in its early stages.

From Gold to Explorers: Signs of a True Bull Market
Bull markets are typically characterized by investors moving progressively up the risk curve as confidence in their thesis grows. In this context, note that while gold prices have been flat since April 21st, precious metals exploration stocks are up 30%.
A true bull market does not take shape until explorers start attracting capital, in our view. These companies usually magnify the cycle — bearing the brunt of downturns but also delivering the strongest gains in the upswings.
In our view, we are now likely just entering a long-term bull phase for mining stocks.

Canada’s Role in Mining Finance
In a recent Gold Telegraph podcast interview, mining billionaire Pierre Lassonde highlighted a striking statistic about Canada: its pension funds, now roughly the size of the nation’s entire economy, allocate only a negligible share of capital domestically. This chronic underinvestment, he suggested, helps explain why Canada’s mining industry has faced persistent difficulties accessing capital.
For decades, Canadian exchanges have been the preferred destination for mining companies worldwide, regardless of whether they operate Canadian projects. The country’s regulatory framework — most notably National Instrument 43-101 (NI 43-101) — enforces rigorous disclosure and reporting standards that foster investor trust and credibility.
This, combined with deep pools of mining-focused capital, flexible listing requirements tailored to early-stage and international miners, extensive sector expertise, and robust liquidity, positioned Canada as the global hub for mining finance.
However, what was once a structural advantage has become a structural headwind.
Canadian pension funds, whose assets now represent nearly 85% of GDP, have steadily redirected capital abroad. Today, only about 4% of their assets remain invested in domestic public markets — the lowest share among all G-10 economies.
The implications for mining are profound. Canada is home to roughly 40% of the world’s publicly listed precious metals companies, yet the sector is starved for liquidity precisely because the largest pools of domestic institutional capital no longer participate meaningfully in their markets.

The End of an Era, The Start of Another
More importantly, as the chart below shows, domestic equities previously accounted for more than one-third of Canadian pension fund allocations.
While this withdrawal has severely constrained access to funding, the current state of under-allocation could mark a turning point.
Here, we align with the perspective of macro strategist Russell Napier, who argues that the global economy is entering a new era defined by de-globalization and rising state influence. In this environment, Western governments — not just the US, but also Canada and Europe — are pursuing policies to onshore critical industries and reinforce domestic production capacity.
This shift, driven by geopolitical tensions, fragile supply chains, and explicit policy incentives, is encouraging institutional investors to reallocate capital toward their domestic priorities. If such trends continue, Canada’s mining industry may once again benefit from renewed access to local pension fund capital — but this time within a framework where state-directed strategies, rather than free-market dynamics, set the tone for investment flows.

Precious Metals: Clarity, Yet Still Early Days
Interestingly, while the precious metals bull market has started to show some clarity, in many ways it has barely begun. One clear indication is the relative performance of miners versus gold prices. Mining stocks have only just broken out of a major downward trend that stretches back to 2006.

Mining Margins in a New Era
As long as metals remain elevated relative to energy prices, mining margins will continue to flourish. Investors are only beginning to take notice, with companies consistently reporting results that exceed analyst expectations. In our view, we may have entered a genuine “Golden Age of Mining.”

To expand on the point above, we believe many mining stocks continue to trade as though gold were priced below $2,000/oz. In reality, most miners are currently producing gold with all-in sustaining costs at roughly half today’s gold price. In our view, these new high margins should soon be driving a substantial upward re-rating of valuations.

Taking Off
The chart below is, of course, just a conceptual illustration — but we may be approaching the early stages of the “take-off” phase, in our view. Institutional interest is starting to build, even as media coverage remains virtually nonexistent.

Consolidation Before the Next Leg Higher
From a historical perspective, secular bull markets in metals are rarely linear; they tend to advance in waves, with periods of consolidation serving to reset sentiment and strengthen the foundation for the next leg higher. By several measures, metals still remain deeply undervalued relative to broader asset classes, particularly when compared against financial assets that have benefited disproportionately from years of monetary and fiscal excess. In our view, this gap underscores both the longevity of the opportunity and the likelihood that we are still in the early innings of a much larger cycle.
The recent price action in gold, rather than signaling weakness, should be interpreted as a healthy consolidation phase — the kind of pause that often precedes another major upward move.

US Dollar vs. Latin American Equities
What we’re seeing today looks like a classic macro “alligator mouth” — a widening gap that, in our view, won’t stay open for long. As global investors begin rotating out of US dollar–based assets, that mouth is likely to close.
One of the biggest opportunities here, in our opinion, lies in emerging market equities. They remain one of the most fundamentally undervalued areas of the market and have historically thrived during prolonged periods of US dollar weakness.
Our case is straightforward: US yields are likely to remain capped, while the dollar faces devaluation. That combination eases financial pressures worldwide — especially for economies burdened with dollar-denominated debt — and redirects capital toward cheaper, higher-growth opportunities abroad.
We believe that the shift is already beginning. With US assets stretched, deficits widening, and structural pressure building on the dollar, we may be entering a multi-year cycle where emerging markets lead global equity performance.

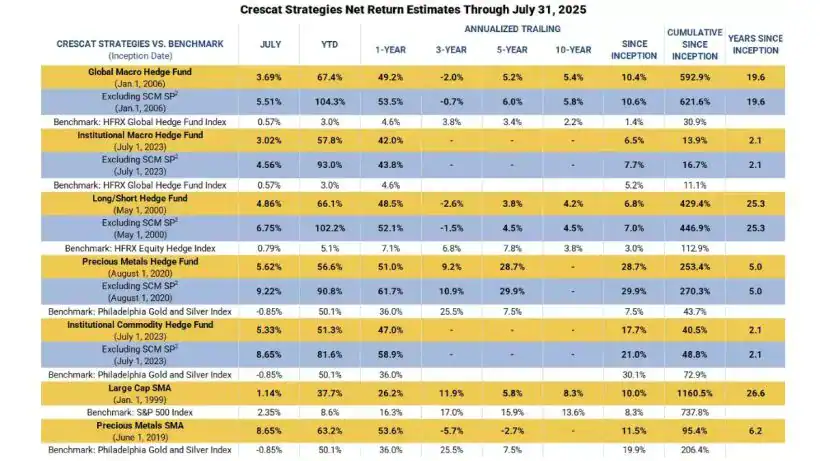
Crescat Fund Performance Charts through 7/31/2025


All Crescat Funds and SMA Composites vs. Benchmarks Performance

Performance data represents past performance, and past performance does not guarantee future results. Performance data is subject to revision following each monthly reconciliation and/or annual audit. Performance figures presented Excluding SCM SP represent the fund’s net returns calculated without the impact of the San Cristobal Mining, Inc. side pocket that was designated on July 1st, 2024. The side pocket includes a private equity asset that is not available to new investors in the funds on or after July 1, 2024. Excluding these assets provides a clearer view of the performance to investors coming into the funds after that date. New investors cannot participate in the SCM Side Pocket and will not share in its potential gains or losses. Investors should consider both the overall performance and the performance excluding the side pocket when evaluating the fund’s returns. Net returns reflect the performance of an investor who invested from inception and is eligible to participate in new issues and side pocket investments. Net returns reflect the reinvestment of dividends and earnings and the deduction of all expenses and fees (including the highest management fee and incentive allocation charged, where applicable). An actual client’s results may vary due to the timing of capital transactions, high watermarks, and performance. Performance figures for the SMA composites have been restated and may differ from performance previously presented in Crescat materials for these strategies. Please see important disclosures regarding this table below.
We are excited about the opportunities in the markets ahead and encourage you to reach out to any of us listed below if you would like to learn more about how our investment vehicles might fit with your individual needs and objectives.
Sincerely,
Kevin C. Smith, CFA
Founding Member & Chief Investment Officer
Tavi Costa
Member & Macro Strategist
Quinton T. Hennigh, PhD
Member & Geologic and Technical Advisor
For more information, including how to invest, please contact:
Marek Iwahashi
Head of Investor Relations
(720) 323-2995
Linda Carleu Smith, CPA
Co-Founding Member & Chief Operating Officer
(303) 228-7371
© 2025 Crescat Capital LLC
Read more hedge fund letters here