Miller Howard Investments’ commentary for the third quarter ended September 30, 2025.
Read more hedge fund letters here
Major US equity indices hit new highs with the S&P 500 Index rising ~8% during the quarter. Corporate earnings also marched to an all-time high, painting a compelling picture that all is well in US markets. Despite this strength, the market has felt a bit like The Cat in the Hat holding up a cup, cake, three books, and a fish on a rake as he precariously balances on a ball. An ever-expanding list of factors to juggle has cast a tremendous amount of uncertainty on inflation and interest rate trajectories.
In late September, we gained more visibility into the path of interest rates when the Federal Reserve (Fed) cut its policy interest rate by 25 basis points to 4.00%-4.25%. The median projection among Federal Open Market Committee (FOMC) participants implies we will see two more cuts that bring the federal funds rate to 3.6% at year end. While the Fed dot plot suggests another cut in 2026, the dispersion of estimates indicates a wide range of potential outcomes.
The latest cut was the first in nine months as the Fed prioritized further neutralizing its currently restrictive policy rate in the face of a weakening labor market. At the Fed’s most recent meeting, Chairman Jerome Powell noted, “Downside risks to employment have risen.” While unemployment remains low, it has edged up to 4.3% as slowing job gains run below the breakeven rate needed to keep unemployment constant. For the first time since April 2021, the ratio of new job openings for each unemployed person also fell below 1x in July.

Alongside labor market weakness, inflation has remained sticky. Though it has eased from mid-2022 levels, it has remained above the Fed’s 2% target for over four years (The Fed’s target is based on the Personal Consumption Expenditures Index (PCE)). Since the end of the first quarter, inflation has edged higher, driven by goods inflation. For August (the latest available data), the PCE and Consumer Price Index for All Urban Consumers (CPI-U) came in at 2.7% and 2.9%, respectively.
At face value, cutting interest rates with inflation still running above the Fed target seems concerning given their generally inverse relationship— even more so with inflation edging higher over the last 4 months. With that said, we are not without precedent as over a half a dozen easing cycles since the 1970s began with inflation at or above 3%.
What makes the current environment unique is the large number of factors casting uncertainty on the economic environment. With executive orders at historic levels, the markets have had to digest massive policy shifts including tariffs, immigration, and deregulation. While more limited in scope, legislation like the One Big Beautiful Bill Act also has material implications. Further complicating matters are questions around AI proliferation (and this relatively narrow segment driving growth), a historically concentrated equity market, Fed independence, and economic data integrity. Given this backdrop, it seems entirely unsurprising that FOMC participants’ assessment of uncertainty around their economic projections lean heavily toward “Higher” (than the past 20 years), and their assessment of the risks to their inflation and unemployment projections are weighted to the upside and risks to GDP growth projections are weighted to the downside.

Multiple Paths Lead to the Same Place
Given the outstanding risks, it is hard to have conviction in a specific course or outcome (at least not without a healthy dose of hubris). As we have discussed in the past, we believe the key is to choose an investment strategy that can work in various environments. With this in mind, we believe it is more informative to explore multiple scenarios based on conceivable risks. To this end, we evaluated how high-yield dividend stocks performed in low-growth, high-inflation, stagflation, and steepeningyield- curve environments.
Low Growth
Real GDP has moderated, largely reflecting a slowdown in consumer spending. Given that roughly 70% of GDP is consumer demand, it seems reasonable to expect that the full consequences of tariffs, deteriorating labor markets, and lower immigration could create additional headwinds to growth for the US economy. We are already seeing signs of credit deterioration among lower-income consumers who are generally more sensitive to labor markets and tariffs. While the Fed’s monetary support is helpful, consumers may not be as interest-rate sensitive as prior periods given interest rates were at historic lows five years ago.
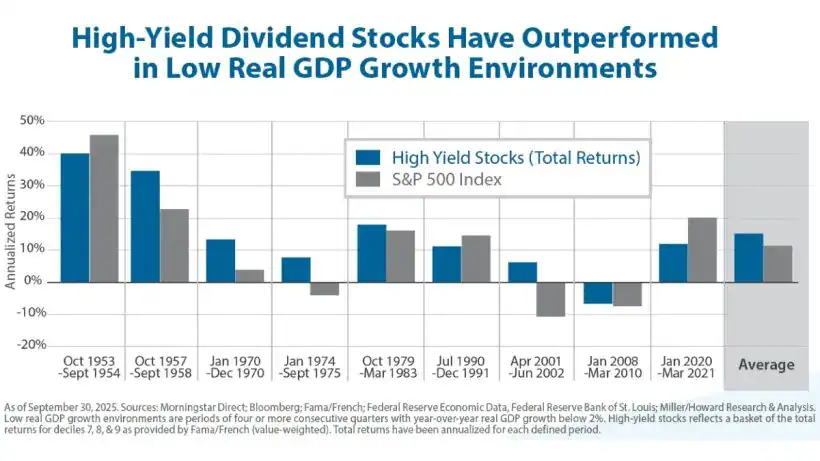
We identified nine periods over the last 75 years in which real GDP growth dropped below 2% for at least a year (real GDP growth was ~2% for the first half of 2025). In these periods, high-yield dividend stocks delivered strong absolute returns, averaging a ~15% annual growth rate. Returns during the 1950s bolstered the average returns, but even excluding these periods, total return averaged a ~9% annual growth rate. Total returns were positive in eight out of nine periods with the Global Financial Crisis as the lone exception. High-yield dividend stocks also exhibited strong relative performance, outperforming the broad market two-thirds of the time and by ~4% on an average annualized basis.

High Inflation
Inflation has been range-bound for the last two years. The median projection among FOMC participants lays out a sanguine trajectory back to its target with an inflation expectation of 2.6% in 2026, 2.1% in 2027, and 2.0% in 2028 and beyond. Public markets aren’t quite as certain. While not extreme, the spread between the 5-year Treasury and 5-year Treasury Inflation-Protected Securities (TIPS) implies an annual inflation expectation of 2.4% over the next five years.
Inflation expectations are—for right or wrong—being heavily influenced by the potential impact from tariffs. While uncertainty remains around tariff negotiations and ultimate levels, it seems likely that the full impact of tariffs has not been felt, and that as time goes on, they are more likely to be passed on to consumers. Tariffs have also been fluid since they were first announced in April, giving us little reason to believe there couldn’t be incremental announcements. Additionally, expansionary monetary policy is commonly viewed as inflationary, adding another upward bias.
We identified six periods over the last 75 years in which the CPI-U was above 3.5% year-overyear— its average over that time—for at least one year. Inflation during these periods ranged from roughly 4.5% to 7.5% with the highest periods of inflation occurring from 1950-1951 and 1973-1985. Across the six periods of high inflation, high-yield dividend stocks delivered positive returns in five of them, again with the Global Financial Crisis being the lone exception. High-yield dividend stocks also exhibited strong relative performance, outperforming the broad market two-thirds of the time and by ~2% on an annualized basis.

Stagflation
Stagflation—commonly defined as a combination of stagnant economic growth, high unemployment, and high inflation—was prominent in the early 1970s to early 1980s. In fact, a member of our sales team, offered to get his platform shoes out of the attic upon hearing we were going to address the topic. The condition has largely been avoided since the 1970s, although discussions of stagflation have increased this year as Jerome Powell has recognized the risks of higher unemployment and higher inflation. While stagflation is not our baseline assumption, we do acknowledge Powell’s point when he said, “We may find ourselves in the challenging scenario in which our dual-mandate goals are in tension.” In this scenario, the risk becomes more palpable.
We identified four periods over the last 75 years in which real GDP dropped below 2% and inflation was above 3.5% (in other words, the combination of the prior two lower-growth and higher-inflation scenarios). For simplicity, unemployment was not used to identify the periods, but it accelerated through each of the periods ending at above-average levels. In these periods of stagflation, high-yield dividend stocks delivered positive returns in each period, averaging an ~11% annual growth rate. High-yield dividend stocks also exhibited strong relative performance, outperforming the broad market three-quarters of the time and by ~5.5% on an average annualized basis.

Steepening Yield Curve
Unlike the disparate views around the potential market risks, investors appear to have coalesced around the idea of a steepening yield curve. This isn’t exactly going out on a limb considering the yield curve has been steepening since mid-2023, but there is strong evidence the trend will continue.
Fed projections suggest the front end of the yield curve is likely to continue to come down. At the same time, the indebtedness of the federal government and expectations for widening deficits could keep the long end of the curve elevated. Swap futures currently point to a continued steepening of ~25 basis points by year end 2026.
We identified four periods over the last nearly 50 years in which the yield curve steepened. In this exercise, we defined yield curve steepening as the yield on the 10-year Treasury minus the yield on the 2-year Treasury increasing by 300 basis points (or more) from trough to peak. The periods were dissimilar in many ways and included times of high inflation, the savings and loan crisis, the dot-com bubble, and the Global Financial Crisis. Still, across all of these periods, the yield curve generally steepened over the course of a three-to-five-year period as the short end of the curve declined faster than the long end of the curve.
During these periods, high-yield dividend stocks posted positive absolute returns. Total return was positive in all four periods, averaging over 10% on an annualized basis. High-yield dividend stocks also exhibited strong relative performance, with returns exceeding the broad market’s return by nearly 5% on an annualized basis. Relative outperformance was most pronounced in the 2000-2003 period, which included the fallout from the dot-com bubble where tech stocks dramatically underperformed the rest of the market.
Miller/Howard continues to believe that investors are best off adopting investment strategies that can control risk and offer reliable returns, even through volatile times. While the ultimate trajectory remains unclear, history suggests high-yield dividend stocks are well positioned to weather multiple potential market environments.

Income-Equity
for more than 30 years, we’ve believed that dividend increases are the strongest signal of management’s confidence in their underlying business, as our portfolio companies generally treat dividend commitments as sacrosanct. This quarter, dividend growth was overwhelmingly driven by our financial holdings, reflecting both this expression of confidence and a supportive macro backdrop. Dividends from 70% of our financials holdings were raised by an average 14%. Further, financials comprised over half of our top 10 performance contributors. Since March, we’ve actively trimmed several of our strong financials performers.
Healthcare also meaningfully contributed, as discounted valuations created opportunities and the Trump administration’s evolving healthcare policies proved more benign than initially feared.
Overall, it was an excellent quarter for our Income-Equity portfolios, driven by strong earnings growth. In the third quarter, our Income-Equity portfolios outperformed their benchmark, the Russell 1000 Value Index. Income-Equity now yields 3.6% while the no- MLP version yields 3.4%, and we project 2025 dividend growth of 5.0% and 4.9% in each portfolio, respectively.

Looking Ahead
AI leaders once again raised their already frenzied spending forecasts this quarter. Meta CEO Mark Zuckerberg put it bluntly: He would rather “misspend a couple hundred billion dollars” than be late to the game. Investors, undeterred, sent related stocks surging—none more so than Oracle (not held). Despite missing expectations on quarterly sales and profits, Oracle shares jumped 35% after announcing a non-binding $100 billion future revenue commitment from OpenAI. That promise is striking given OpenAI’s current business rests largely on $240-per-year premium subscriptions—alone hardly sufficient to fund its growth ambitions.
Oracle itself carries $100 billion in net debt (3.5x EBITDA), yet plans to triple its own capital spending to $60 billion annually, far beyond its current cash flow. If this sounds familiar, you likely remember the late 1990s. Back then, vendor financing, where sellers loan or invest directly in their customers, helped inflate the dot-com bubble. Cisco, Sun, Lucent, Nortel, WorldCom, and Global Crossing all fueled startups or struck reciprocal deals to justify ever-higher valuations.
Today’s euphoria is again rooted in astounding technological change. Walmart, JPMorgan, and countless others are racing to adopt AI, promising efficiency gains (often code for layoffs) and higher profitability. We, too, are personally and professionally captivated by the possibilities. Where we believe we differ from the market is in how the spoils will ultimately be divided. The most immediate consequence of the AI arms race is soaring spending by the “Mag 7,”* and the erosion of their free cash flow. Since 2023, annual capital expenditures among the Mag 7 have more than doubled and are expected to be just under half a trillion dollars by 2027. Without corresponding sales growth, Mag 7 capex as a share of revenue has surged more than 50%. By contrast, our Income-Equity holdings’ capex remains well aligned with long-term trends.

How does this impact free cash flow? In 2020, $100 invested across the Mag 7 generated $3 in free cash versus roughly $6 for an equal-sized investment in our Income-Equity (no MLPs) portfolio. Today, with valuations stretched and cash flow weighed down by AI investment, the same $100 in the Mag 7 is expected to yield just $2/year, compared with $5/year in our Income- Equity (no MLPs) portfolio. Put differently, the Mag 7 must grow annual cash flows 250% from current levels to simply match our portfolio— assuming our companies don’t grow at all, which isn’t very likely in our opinion.
We believe it’s more probable that, as Mark Zuckerberg himself has noted, a meaningful share of today’s frenetic spending will prove obsolete or serve to create income streams that cannibalize existing business. Our income-producing companies, by contrast, are positioned to capture AI-driven efficiencies without bearing the considerable costs and risks of a speculative arms race.
Meanwhile, in our view, investors—often unknowingly—are taking the speculative side of this trade. Consider our benchmark, the Russell 1000 Value Index. On June 30, Russell added Meta, Amazon, and Alphabet (none of which we hold) at a combined 6% weight. Each trades at a premium to the already lofty S&P 500 Index priceto- earnings (P/E) multiple and pays only a token dividend. Their inclusion in a value index, with markets near all-time highs, is curious at best.
With tech’s strength encouraging “style drift” among both performance-chasing active managers and supposedly “passive” indices, we reaffirm our commitment to a true equityincome solution, guided by three principles: high current income, growth of income, and financial strength. Knowing what one owns has rarely been more important. In a market increasingly concentrated in a handful of expensive growth stocks with deteriorating cash flows, the Miller/Howard Income-Equity portfolios remain a genuinely diversifying portfolio, focused on high and rising income for our clients.
Portfolio Highlights
- Dividend increases: Income-Equity (no MLPs) had 12 dividend increases in the quarter, led by the banks, with particularly large increases from JPMorgan Chase (JPM), Goldman Sachs (GS), State Street (STT), and Bank of New York Mellon (BK). Outside banks, H&R Block (HRB) had a noteworthy 12% increase. Income- Equity (with MLPs) had 13 increases, with Enterprise Products Partners (EPD) delivering its 26th year of consecutive dividend growth.
- New buys: We added three new names this quarter. In energy, we bought ConocoPhillips (COP), a pure-play oil and gas producer nearing the end of a major investment cycle. Three large projects coming online are expected to generate $3 billion in annual cash flow, while reduced capital spending adds another $3 billion. Conoco also holds, in our view, the deepest remaining high-quality drilling inventory in the Permian Basin. We initiated Equity Lifestyle Properties (ELS), a REIT with a nationwide portfolio of manufactured housing and RV properties, where it collects rent on the plots of land. Lastly, we bought Hormel (HRL), a grocery mainstay with protein-heavy offerings, that is wellpositioned for favorable consumer trends.
- Exited positions: We exited our longstanding holding in TotalEnergies (TTE). While Total remains a well-run company, we see aggressive buybacks and growth spending making dividend coverage too thin in a weak oil market. We also sold Conagra Brands (CAG), losing confidence that a complacent management team can adapt to industry challenges by innovating or revitalizing its legacy brands. The resulting strain has weakened both Conagra’s balance sheet and dividend coverage. Finally, we trimmed financials Bank of New York and JPMorgan on strong price performance.
MLP & Midstream Energy Income
Overall, we believe the recent earnings season was a good one. A few companies raised guidance while a few others slightly trimmed their outlooks. The natural gas business remains hot, with several projects announced that are tied to growing demand, primarily around data centers. The natural gas liquids (NGL) business was weaker, with fundamentals impacting earnings for those companies. We are also continuing to watch liquified petroleum gas (LPG) export competition heat up.
The positive news around natural gas demand begs the question: Why aren’t natural gasfocused stocks performing better? First, most of the announced projects are longer-term, likely not impacting EBITDA until 2027. Second, the midstream natural gas trade was very strong in 2024 when news around the data center build-out started. Third, although most of the midstream industry’s income is derived from fee-based operations, weaker natural gas prices weighed on the industry recently. The summer cooling season went out with a whimper, not a bang.
Looking Ahead
We continue to have faith in the tailwinds for the sector—electrification trends, natural gas exports, increasing gas-to-oil ratios, and data centers. We have seen a step-change in natural gas demand dynamics between 2014 and 2024, and we believe this is just the beginning. Hyperscalers’ capex continues to increase, with the majority of these projects powered by natural gas. The midstream industry is responding, with over $10B of new projects announced recently. We would be remiss not to state that the near-term uptick in capex does lower free cash flow. However, once projects become operational, we expect higher cash flow, which should ultimately be returned to investors through distribution increases and, potentially, share buybacks.
Portfolio Highlights
- Distribution increases: This quarter 4 of our 16 holdings announced dividend increases. The average increase was 5.3% year-over-year.
- Sales: We trimmed our position in Enbridge (ENB) to allocate to another holding. We trimmed Enterprise Products (EPD), although we continue to view the company as a core holding.
- Buys: We increased our position in Hess Midstream (HESM) as the current yield plus potential growth of income is attractive, in our view. We increased our weight in Genesis Energy (GEL) as we see free cash flow hitting an inflection point in 2025.

Infrastructure
Our infrastructure portfolio recorded positive performance for the third quarter in a row and outperformed its benchmark. However, the infrastructure space as a whole failed to keep pace with the broad market, which benefited from artificial intelligence (AI) enthusiasm and expectations of further monetary easing.
Within our Infrastructure portfolio, performance ran counter to broad market trends as the highest yielding positions outperformed, and the highest growth positions underperformed. Utilities led the portfolio, benefitting from idiosyncratic events like positive regulatory results, legal rulings, asset sales, and data center opportunities. Midstream energy also outperformed, led by more defensive names as natural gas positions took a breather. Cell towers lagged the portfolio on lower growth expectations and EchoStar’s (not held) spectrum sales.
Looking Ahead
AI remains in the spotlight as major tech companies invest billions in data center infrastructure and sign agreements to secure reliable energy. Recent AI advancements have largely been driven by scaling up computational power and model sizes, which demands greater energy consumption. This is especially true for “Frontier AI Models”, such as GPT-5, Gemini 2.5, and Llama 4, which are trained using high levels of computational power and energy to match or exceed the capabilities of advanced AI models at the time of their release.
AI training has required increasingly more computational power and energy, with usage of each doubling every ~5.5 months and ~1.2 years, respectively. It seems logical that this trend will continue for the next generation of AI models.
Our Infrastructure portfolio remains well positioned to benefit from these trends and others with broad-based exposure across multiple sectors. We expect utilities to benefit from regulated power generation and transmission projects, independent power producers to benefit from tighter power markets, and midstream to benefit from higher natural gas volumes. Overall, we expect these tailwinds to enhance the portfolio’s ability to provide a high and rising income stream for investors.
Portfolio Highlights
- Dividend increases: This quarter, 2 of our 35 holdings announced dividend increases with an average increase of 9.5% year-over-year.
- New position: We initiated a position in Crown Castle (CCI) and expect the company’s operating leverage to amplify US data demand tailwinds. Recent portfolio restructuring provides the company with relative advantages over cell tower peers.
- Exiting position: We exited Comcast (CMCSA) with the expectation that broadband growth will face continued challenges from fiber and fixed wireless trends.

Utilities Plus
Utilities recorded positive performance for the seventh time in the last eight quarters. The sector largely kept pace with the broad market, driven by benefits from AI enthusiasm and expectations of further monetary easing. Despite the Federal Reserve announcing its first rate cut in nine months, the yield on the 10-year Treasury was rangebound. During the quarter, the utilities sector significantly outperformed other defensive sectors such as consumer staples and healthcare. Utilities remain ahead of the broad market year-to-date due to strong outperformance in the first quarter. Within the group, the largest capitalization names generally underperformed, and the smallest capitalization names outperformed. Top performers included gas local distribution companies (LDCs) and renewable developers that benefitted from improved regulatory visibility. Water utilities underperformed in the risk-on environment due in part to their elevated valuation multiples and less differentiated growth profiles. Notably, independent power producers (IPPs) took a breather following massive outperformance in the second quarter.
Looking Ahead
Excitement around data centers, reshoring of manufacturing, and electrification trends—and their implications for US electricity demand— have been a major driver of utility performance. While investor attention has been focused on the requisite power generation, the high-voltage transmission needed to deliver that power has largely flown under the radar. The DOE’s 2024 National Transmission Planning Study called for a morethan- doubling of current transmission capacity by 2050. This implies the need to build 5,000 miles per year of high-capacity transmission—or nearly ten times the 2020-2024 average of 536 miles. The required run rate is higher than any single year in the last 15 years. While permitting and the sheer scale of deployment will likely provide challenges, there is a clear opportunity for utilities to deploy incremental capital and earn a regulated return. Due to utilities’ formulaic connection between spending levels and earnings growth, this capex will only bolster utilities’ growth and their ability to provide investors with high and rising income.
Portfolio Highlights
- Dividend increases: This quarter, 4 of our 32 holdings announced dividend increases with an average increase of 3.4% year-over-year.
- New position: We initiated a position in NRG Energy (NRG), which we expect to benefit from tightening power markets and the opportunity to execute contracts with data centers for power at premium pricing.
- Elevated multiples: We trimmed our positions in NiSource (NI) and CenterPoint Energy (CNP) after periods of relative outperformance pushed their valuation multiples to significant premiums versus peers.

North American Energy (without K-1s)
Although benchmark crude oil prices held steady in the mid-$60/bbl range this quarter, energy equities extended their strong rebound from April’s tariff-related lows. Returns were led by refiners that posted Ukraine war-driven windfall profits. Also, Canadian producers benefited from improved local price realizations versus global benchmarks—a dynamic we have long positioned for in this portfolio.
In contrast, US natural gas prices fell more than 11% from mid-July highs. Summer natural gas demand was tempered by cheap coal (a substitute fuel), growing renewable capacity, and slightly cooler weather versus last year. On the supply side, robust gas output growth more than offset rising liquefied natural gas (LNG) exports and secular AI-driven power demand.
Looking Ahead
With a relatively stable macro backdrop, we see an opportunity to step back and focus on structural drivers for the years ahead. We expect US crude production to decline ~2% over the next 12 months, with rig counts now 30% below post-COVID highs. In recent quarters, OPEC+ has restored supply aggressively, while disciplined US operators have cut activity to help avoid a price downturn. The industry’s ability to calibrate production quickly to demand remains a defining—and undervalued—feature of shale.
Why does this matter? If global drilling stopped today, output would fall by 5.9 million barrels per day (Mbpd) annually—a 6% decline—versus only 3% per year 25 years ago. Shale’s fast-decline profile and increased share of global production make supply inherently fragile. We see this as a key reason why, despite lukewarm near-term fundamentals, energy equities remain resilient and attractive.
Portfolio Highlights
- Energy and income: The portfolio currently offers an indicated yield of 2.9%. We view this to be well supported down to roughly $45/bbl oil, with the potential for significantly larger variable capital returns at higher commodity prices.
- Along the energy value chain: In industry news, Western Midstream (not held) agreed to acquire ARIS Water Solutions (not held) for $1.5B in cash and stock—a 25% premium to the prior close. The Permian Basin produces three barrels of water for every barrel of oil, making wastewater remediation a key growth industry. The deal underscored the value of our Select Water Solutions (WTTR) holding, where we added to our position on the news. Later in the quarter, we took gains in HF Sinclair (DINO) and reinvested into natural gas and natural gas liquids (NGL) producer Antero Resources (AR).

Yield, Growth, Strength, Stability
- Our Income-Equity portfolios each offer a high dividend yield that is approximately 3x the yield on the S&P 500 Index, and have ample dividend coverage and reasonable leverage levels (net debt/EBITDA).
- Both portfolios trade at a significant discount to the broad market on price-to-earnings as well.
- We believe the portfolios are well-positioned for dividend growth throughout the full market cycle.


Infrastructure: Essential Service Providers with High Barriers to Entry
- Our Infrastructure portfolio offers a high dividend yield that is over 2.5x the yield on the S&P 500 Index, strong prospects for dividend growth, and ample dividend coverage.
- The portfolio offers overall client portfolio diversification, as its active share relative to the S&P 500 is high and investors are under-exposed to these stocks through the broad market, as evidenced by low common holdings.
- In an uncertain market environment, we believe lower beta, high current income, and growth of income will prove to be an advantageous combination for investors.