

Your pain is the breaking of the shell that encloses your understanding. ”
~ Khlail Ghibran
Q2 2021 hedge fund letters, conferences and more
Good morning!
In this week’s Dirty Dozen [CHART PACK] we look at the current market regime and discuss the characteristics and statistics for it. We then contrast this with the odd divergences we’re seeing in breadth and the ever-rising Trend Fragility with some indicators of positioning at all-time record highs. We then check out gold, materials, and an Agtech play, plus more…
Let’s dive in.
- The Qs are in a Neutral to Bull Quiet regime (aka, Blended Bull). In this regime the best sell setups fail and the market slowly grinds higher. Markets peak in Bull Volatile regimes (dark green bars), as shown below.

- The graph below shows the Nasdaq’s best returns come in Neutral and Bull Quiet regimes (grey and light green lines). And the bottom graph shows that Qs spend most of their time trading in a Bull Quiet, which is expected since indices drift higher over time.

- Short-term breadth dipped near oversold levels last week. These levels tend to coincide with durable bottoms unless the selloff morphs into a larger bear market a la late 18’ and early 20’.

- Pulling back, there’s a lot going on under the hood of this market. The spread between the % of members trading above their 200 and 50-day moving averages is at its widest point since early 2011. This means that while most stocks remain above their 200-days, a large number of them are now trending below their 50-days, indicating waning breadth and momentum. This type of action typically precedes intermediate peaks.

- Our Trend Fragility indicator is now in its 98th percentile. This indicator aggregates a number of sentiment, positioning, and technical data. The last time Trend Fragility was this high was in January 2018.
Our volatility-based Nervous & Numb indicator also shows rising nervousness about the durability of this trend.

- Large Spec net positioning in the SPX is in its 88th percentile and rising. The last time spec positioning was this bullish was in February of last year, right before the crash.

- And TD Ameritrade’s IMX indicator which measures actual flows and positioning of millions of retail accounts, is at its highest levels on record, recently surpassing the previous Jan 18’ high.
I’m not trying to sound Northman Traderesque’ here… The trend is still up and credit is still confirming that trend, so the path of least resistance is higher for now. But this comes with very high trend fragility. Meaning we want to stay long but be very responsive to critical changes, because when the turn comes we’ll likely enter an extended sideways to down market regime.

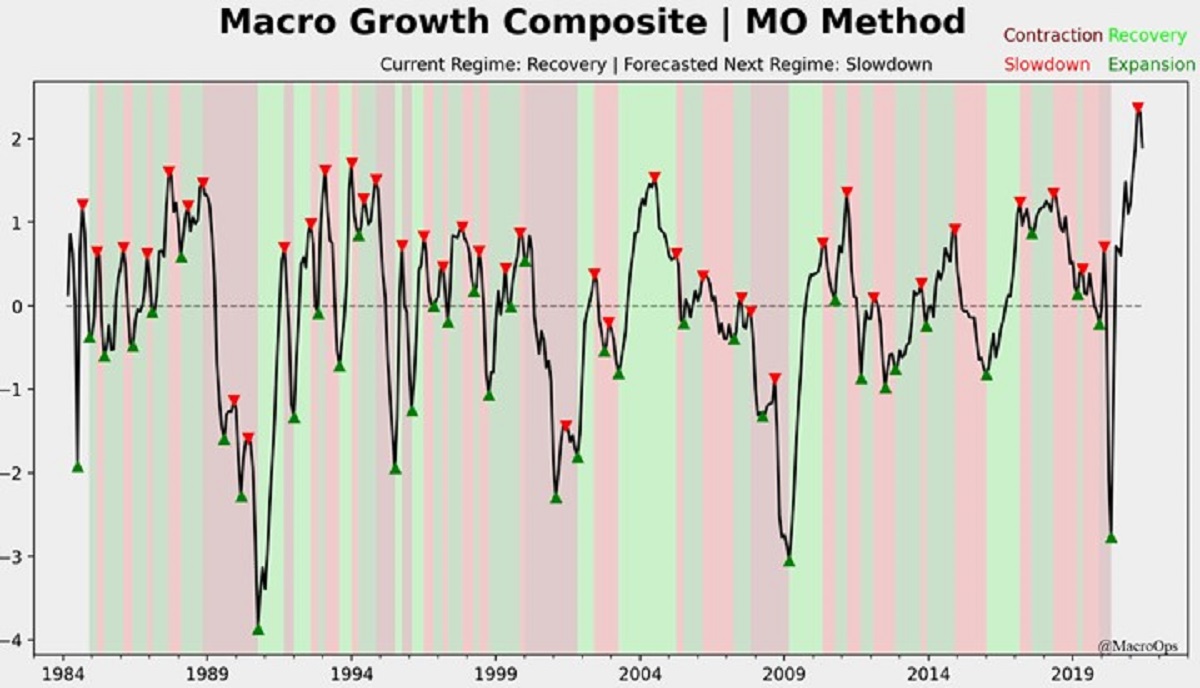
- Our Composite Growth model predicts we’re moving from a recovery and growth phase into a slowdown, where growth is still positive but the delta is lower.

- Here’s the mean performance for various assets per regime. Qs, bonds, and high dividend payers tend to be the outperformers in this regime.

- I shared this chart last month in a note to members of our Collective, pointing out how gold tends to respect its monthly Bollinger Band midline when in a bull trend. And as the following chart shows, this so far seems to be holding true.


- Positioning is still more crowded than I’d like to see in PMs, though they’re in their strongest period of seasonality which lasts until about mid-September. Maybe we see a bit more sideways chops that wrings out the weak hands and then a resumption of the bull trend once this Buy Climax in equities ends.

- The materials sector is seeing a spike in MACD Buy Signals. It also has one of the better relative Forward EPS profiles.
One company I’m digging into in this space is Corteva (CTVA). They’re an Agtech play headquartered here in the US but with operations around the globe.
It has a nice chart. It’s in a 3-month pullback within a strong uptrend and is nearing its 200-day moving average. Will be digging into its fundies this week to see if there’s anything there.


If you enjoy reading these Dirty Dozens each week then please feel free to share them on the Twitters, forward them to a friend, or translate them via smoke signal, etc… Every bit helps us get our name out there.
Thanks for reading.
Stay safe out there and keep your head on a swivel.
Article by Alex Barrow, Macro Ops


