

“Davidson” submits:
Q3 2022 hedge fund letters, conferences and more
Where to begin when so many are so wrong about so much. If one looks at the details, the data does not support the pessimism, the Fed’s policy, government policy nor the misdirection from experts. Clearly, everyone is pessimistic. They all agree that rates need to be higher to quash inflation. They all agree that inflation comes from higher employment and consumer spending. They all agree that a recession is the only solution. They all agree Russia-Ukraine conflict is the cause. None of these perceptions are supported by the data. Yet, investors themselves spur the Fed to invert the yield curve further and it is these investors who do so in anticipation. Then, they blame the Fed. The thinking is messy, very messy with most reacting to feedback from price-trends that they themselves create thinking they are following market signals. This is cognitive dissonance on a massive scale. It is also an investment opportunity if we can sort through it all to the fundamentals. Much of this has been presented separately in prior notes but, in truth, each is in messy combination with the others.
Eight charts are presented to show relationships between conflicting and correlating data sets from which investment and policy decisions derive. Part of the ‘messy thinking’ comes from lumping sentiment indicators and economic indicators as if they have the same value in the same direction. The commonly held belief is if something has a low price, then it is worth less. If I claim this concept is taught in our major business schools, if you have a business degree, most recognize this as so. If the price of something has declined, it is because the market believes it is worth less. Pause a moment to think through this concept.
If something with which you are familiar, a pound of butter, an air conditioner or say a Ford 150 pickup truck, sound functionally, suddenly decline in price, would you see it worth less or having greater value for the price paid? If it is the identical item, with same amount of functional value at the higher price, would this item not be a better functional value at a lower price? Would not a lower price tempt you to buy it? Perhaps even buy multiple units if you anticipate consuming them before they become unusable? We do this every day when thinking of food items. Why then, when stocks decline in price, do we feel they represent less functional value? The fact remains, we perceive low stock prices as carrying higher levels of risk and we are unwilling to invest precisely when this is the best level to invest if we know how to evaluate the situation. This is part of the messy thinking today.
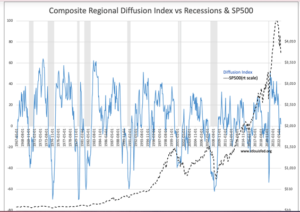
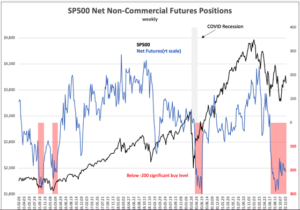
Charts 1&2 represent correlated sentiment indicators. Net non-commercial futures and Fed Regional Diffusion Indices correlate to the SP500 and recession periods. The Red Columns in Chart 1 represent the period when the net non-commercial futures are below (negative) -200. Below this level corresponds to the best times to buy the SP500. In Chart 2, negative Fed Diffusion Indices correlate with best times to buy the SP500. In turn each correlates with recession periods and periods of high pessimism i.e., periods when few are willing to buy equities. But, if one recognizes the longer-term functional value an equity represents, then high pessimism represents the best time to buy value in equities or any security representing that functional value. Investment securities are only tokens representing a group of people (a company) producing a product(s) or service(s) that meet societal needs. If the business-value was there prior to the price decline and analysis indicates that the business-value will recover to the same or higher level in the future, then the current price decline represents a buying opportunity. Charts 1&2 indicate current high pessimism is equal to prior periods of opportunistic market buying periods i.e., the lows have been made or close to current levels. Many today express the belief that another 30%-50% decline is ahead due to this pessimism. But, if one reviews the past, someone said the same at every market low with the same conditions as today. Part of the cognitive dissonance today comes from not seeing that the functional value of equities is higher at low prices not less. This is the same at every prior major low.

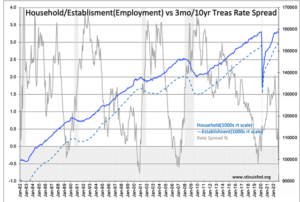
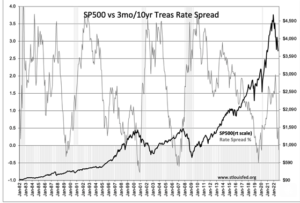
Charts 3&4 correlate the 3mo/10yr Treasury rate spread, the Yield Curve Inversion Indicator, to recessions, employment and the SP500.
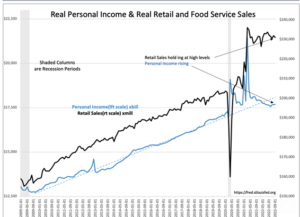
Investors have recognized that yield curve inversion, when the 3mo rate exceeds the 10yr rate precedes recessions. This pattern has been incorporated as a significant input in trading algorithms. Algorithms are designed to anticipate risks to portfolios such that a manager can execute hedges to offset risk before other traders have taken the opportunity to do so and diminish the potential value of the hedge. In a marketplace where everyone has the same business school training and perspective, the same availability of computer power and the same limited number of hedging opportunities it does not take very long before all act in the same fashion even though they believe they are not in concert. Without examining the details of past yield curve inversions, it has evolved into a nearly 100% consensus that the current signal guarantees a recession and further equity market declines. What they are missing being focused on algorithms are employment (Chart 3) and retail sales and personal income trends .
Prior yield curve inversions have always reflected excess market speculation at a time when employment, personal income and retail sales had stalled for 12mos-24mos and delinquency rates had risen sharply prior indicating that a high level of financial stress had built up during the cycle. Yield curve inversion was only the last straw as lending margins collapsed. The current trends in employment and personal income are rising while retail sales are holding at high levels as consumers transition from being at home to reentering the workplace.
But there is more. New Orders for Durable Goods are at record levels and rising. https://fred.stlouisfed.org/series/DGORDER COVID supply-chain issues stirred many corporations to shift operations out of foreign markets to increase on-shoring. https://www.engineering.com/story/reshoring-is-soaring-in-2022350000-new-jobs-predicted While many speak of layoffs in COVID-favored issues, total employment trends continue higher with newly added on-shoring. The losses of high-wage technology jobs are also being replaced with a higher number of decent-wage manufacturing jobs such that it is increasing personal income. These fundamental trends are reinforced by recent earnings calls of US industries in multiple sectors reporting accelerating backlogs. A picture emerges when combined of general economic expansion post-COVID. Economic conditions are not recessionary or even signaling recession.
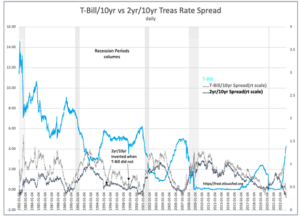
One last point on the yield curve inversion signal. The yield curve just inverted to record levels. The 3mo/10yr Treasury inversion recorded -0.77% in 2001. That was broken this week as the differential spiked to -0.81%. The majority of portfolio managers have hedged for these expectations. Portfolios are measured in $Trillions these days and need hedging with any available tool. It is no longer about individual issues but comparisons of trends in all asset classes on a global basis that includes equities, fixed income, commodities, and associated derivatives. The chart below reveals a new hedging technique not deployed in prior periods.
That technique is to roll safe-haven capital into 5yr-10yr Treasuries. Every prior inversion, recession and market correction T-Bill rates declined sharply as investors sought saft-havens. (Same for 2yr Treasuries) This time the 3mo is not the preferred hedge but its higher rate shows that capital has moved elsewhere as a hedge. The new strategy is to buy 5yr-10yr Treasuries. Past corrections produced 20%-30% gains in duration-managed intermediate Treasuries. https://www.zerohedge.com/markets/yield-curve-telling-us-next-fed-cutting-cycle-could-be-big As part of this strategy is a chorus of managers demanding the Fed raise Fed Funds to counter inflationary pressure. Managers have never called for such a rise prior. It appears they are pushing for higher short-term rates to invert the yield curve further hoping to benefit from falling rates thereafter. A self-fulfilling feedback loop? Certainly, part of messy thinking!
Charts 7&8 relate to the messiest thinking of all, inflation. Aside from both portfolio managers and the Fed calling for higher rates to conquer inflation is the misperception of inflation’s cause and its cure. Cognitive dissonance regarding inflation has been part of financial markets forever but for one bright spot when Milton Friedman related inflation to government spending. There is always considerable interesting in expanding government spending as if it is a free-lunch. This has left Friedman’s concise causal relationship with government spending ignored within moments of its declaration. The latest bout of inflation provides detail to evaluate inflation causality compared against portfolio manager perception vs the events as they unfolded. This leaves both the Fed and managers demanding identical misperceived cures.
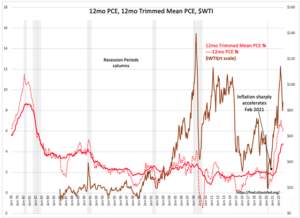
Charts 7&8 feature the PCE as the inflation measure with the 12mo Trimmed Mean PCE compiled by the Dallas Fed as the Feds preferred inflation indicator. Chart 7 has the history of $WTI (crude oil futures price) and Chart 8 has the …M2 history(money supply) from 1978. Commodity price changes as well as rises in …M2 have been deemed causal for inflation by money managers and the Fed alike as far back in time one wishes to trace the commentary. Friedman said not so. While there are some peaks in $WTI appear correlated to PCE, some do not and neither does the price-shift magnitude. What is notable are price swings from COVID and thereafter are uncorrelated to PCE. The Russia-Ukraine conflict is also spoken as causal for inflation even though this did not begin till Feb 24, 2022 while inflation began to soar Feb 2021. Note that in Mar 2020 PCE inflation was 1.34% and was virtually unchanged Jan 2021 1.41.% not only against a rise in $WTI but with a substantial rise in …M2. The single event which does correlate is that on Jan 20, 2021 government policies were changed, then the Mar 2021 inflation report posted 2.45% and as the Russia-Ukraine conflict began was already 6.64%. The argument that commodity price rises or a rise in M2 or Russia-Ukraine are singly responsible for inflation does not hold up to scrutiny. Thus, the actions to dump 40% of the SPR into oil markets to bring prices down to in turn bring inflation lower has had no impact on PCE as in the chart. Oil prices and inflation are simply unrelated with many adjustments society can tweak to maintain standards of living.
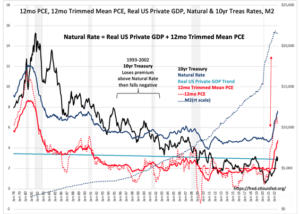
The other argument which managers and the Fed are supporting today is the rise in employment and consumer demand for goods is responsible. The cure is simple both say, raise rates to cause a recession and lower employment. This solution is not supported by either Chart 3 or Chart 8. Inflation fell throughout the 1980s-till Feb 2021’s PCE report with substantial rises in employment and presumably a considerable rise in the consumer demand with M2 rising significantly along the way. This leaves the causal argument for inflation spurious.
To understand inflation and what Friedman saw, one must work through his reasoning, since then lost in the rush to be quoted by the media. …M2 rises whenever debt is issued. Think of new debt as the issuance of new currency.
- When debt is issued by corporations, it is to supply products/services to consumers for profit. When consumers spend income, they do so to gain more value than they gave up in earning that income. This is how consumers improve their standard of living. In a competitive marketplace, only those companies who supply the most value and make a profit succeed. It is choosey consumers who decide which businesses survive or fail. Failed companies default on debt. This results in writing off that debt and associated currency leaving no net impact on inflation. The pathway to consumer’s pocketbooks requires the most efficient use of society’s resources. This makes consumer spending always deflationary i.e., adds value to the economy. The growth in …M2 used to satisfy consumers is deflationary as more value is created for currency issued (debt becomes converted to equity as the debt is paid off).
- When debt is issued by government it does so for without consumers driving profitability. …M2 rises, government spends but never adds enough value to the economy which makes government spending an inflationary enterprise. Spending for war is particularly inflationary, literally the destruction of value, reducing the value of assets on an expanded currency base. Much of the spending, however, is politically driven to enhance the current administration’s power base. Projects routinely fail to add value. Reversing the impact of inflation by government issued …M2 takes years as can be seen in the slow inflation decline from Volcker’s actions in 1982.
Since the US economy grows long-term just under 3%, a sudden rise in …M2 above the historic pace of the US economy is always inflationary. It takes several years of consumer deflationary activity to achieve the prior inflation level. Inflation can be reversed if government spending and issuance of …M2 is reversed, There is no sign of that occurring. The current perception of inflation as being temporary with rates reversing shortly is misplaced in my opinion. The Fed speaking as if consumers are responsible for inflation is likewise misplaced. The philosophy that higher rates to reduce demand through higher unemployment to lower inflation is entirely misplaced. Individuals working productively is as deflationary an activity as society has.
(The Natural Rate is shown in Chart 8. It is a concept of Knut Wicksell, 1898, to estimate the true cost of longer-term capital i.e., across multiple business cycles. It tracked the 10yr Treasury rate from 1978-2002. Thereafter, global capital pooled in the US with globalization and EmgMkt strategies which kept pushing rates well below a 3% Real rate of return. This worldwide effect caused Sovereign Debt of some countries to fall to negative rates such was the pressure to enter safe havens in Western markets without capacity to handle it. Current pressure from global capital flows continue to keep 10yr rates below the true cost of capital.)
To sum the points in this narrative:
-
The belief: Every portfolio manager is hedged against a recession/market decline and a reversal of inflation. Their self-confidence is so high that considerable capital is invested for a significant market decline.
-
The reality: Economic activity continues to expand with inflation continuing above 4% at least a couple of years with higher rates to follow.
The economy has already shown it can operate with high inflation and high rates in the 1970s. It will take rates at least 2%-3% above inflation to push the US into recession i.e., rates near 7%-8% with the 12mo Trimmed Mean PCE currently at 4.74%. Meanwhile, on-shoring and strong demand for aircraft, motor vehicles let companies pass on inflation’s costs. Corporate profitability should be sound as long as profit margins exceed cost of capital. In my opinion, the best investment strategy is to invest with the economic trends and in those companies most likely to benefit.
The consensus appears poorly positioned for continued inflation and continued economic growth. The reversal of their current positioning should prove positive for US equities that have been out-of-favor for several years.

