
Transaction Costs of Factor-Investing Strategies
- Feifei Li, Tzee-Man Chow, Alex Pickard & Yadwinder Garg
- Financial Analysts Journal
- A version of this paper can be found here
- Want to read our summaries of academic finance papers? Check out our Academic Research Insight category
Q3 2019 hedge fund letters, conferences and more
What are the research questions?
Transaction costs are a major concern for practitioners attempting to implement factors investing strategies identified in academic literature. Naturally, this is a subject that has been covered before here, here, and here, but a new look at transaction costs never hurts.
The authors of this paper look to analyze the trading costs of rebalancing factor portfolios by employing a model of implicit market impact costs as a function of liquidity and size of trade as a means of estimating the transaction costs. The factor strategies vary with respect to turnover rate, trade size, liquidity, concentrations, and the number of rebalances. The data is limited to commercially available, long-only indexes with transparent rules for including securities and weighting schemes. International and domestic vehicles are investigated. However, in our review, only the domestic slice is being reported. In addition to explicit costs of trading (commissions, taxes, and other misc charges), the implicit costs due to the market impact of trading and its’ effect on the value of the index make up total rebalancing costs for a strategy. The authors argue the large volume of buy and sell orders executed simultaneously for the same securities may result in adverse movements against the index value and detract from investor returns. The implicit cost can be very large when compared to explicit costs but are essentially invisible.
A description of the results follows.
What are the Academic Insights?
COST OF IMPLEMENTATION
Annual market impact costs
MOST EXPENSIVE: Momentum
2.05% to 2.72%
Negatives: Highest turnover, lowest capacity, lowest volume, likely concentrated holdings, trading at a fast pace; Mitigating characteristics: Lowest tilt, that is the degree to which the portfolio-holding weights deviate from a volume-weighted portfolio, which is the most liquid combination of a given set of stocks, likely close to market weights
NEXT MOST EXPENSIVE: Income strategies
0.61% to 0.76%
Negatives: Low volume, high tilts due to weighting by yield; Mitigating: Low turnover
MODERATE: Multifactor strategies
0.12% to 0.23%
Mitigating: Costs remain moderate even though construction is more complex; capacity higher than min volatility and single factor quality strategies; high volume; diversification across various factors reduces turnover and raises volume
MODERATE: Quality strategies
0.11% to 0.37%
MODERATE: Concentrated Value strategies
0.02% to 0.28%
Negatives: Much lower capacity than fundamentally weighted value strategies, second to highest volatility; Mitigating: Low tilt
CHEAPEST: Fundamental value indexing
0.02%
Mitigating: High capacity, high volume, lowest turnover, low tilt similar to cap-weighted strategies correlated with high volume securities
LARGEST COST SPREAD: Low volatility/beta
0.05% to 1.90%
Negatives: The wide range in cost should be related to index design, however, the highest cost strategy has the simplest construction rule; Mitigating: Lowest volatility overall
Why does it matter?
A FEW CAVEATS MATTER: 1. The model may overestimate the cost due to large changes in positions when those changes are anticipated such as index reconstitutions. The methodology also assumes all portfolio managers rebalance on the same trading day, perhaps an unrealistic assumption. 2. It is difficult to estimate relative sizes of trades in advance of rebalancing for a specific strategy, especially if similar strategies rebalance on the same day and compete for liquidity, for example. 3. Portfolio managers may also use crossing networks, dark pools or other off-exchange venues.
Therefore, the results should be more appropriately used to gauge the potential invisible costs and capacities associated with various factor investing strategies that vary with respect to design and selection of factors.
The most important chart from the paper
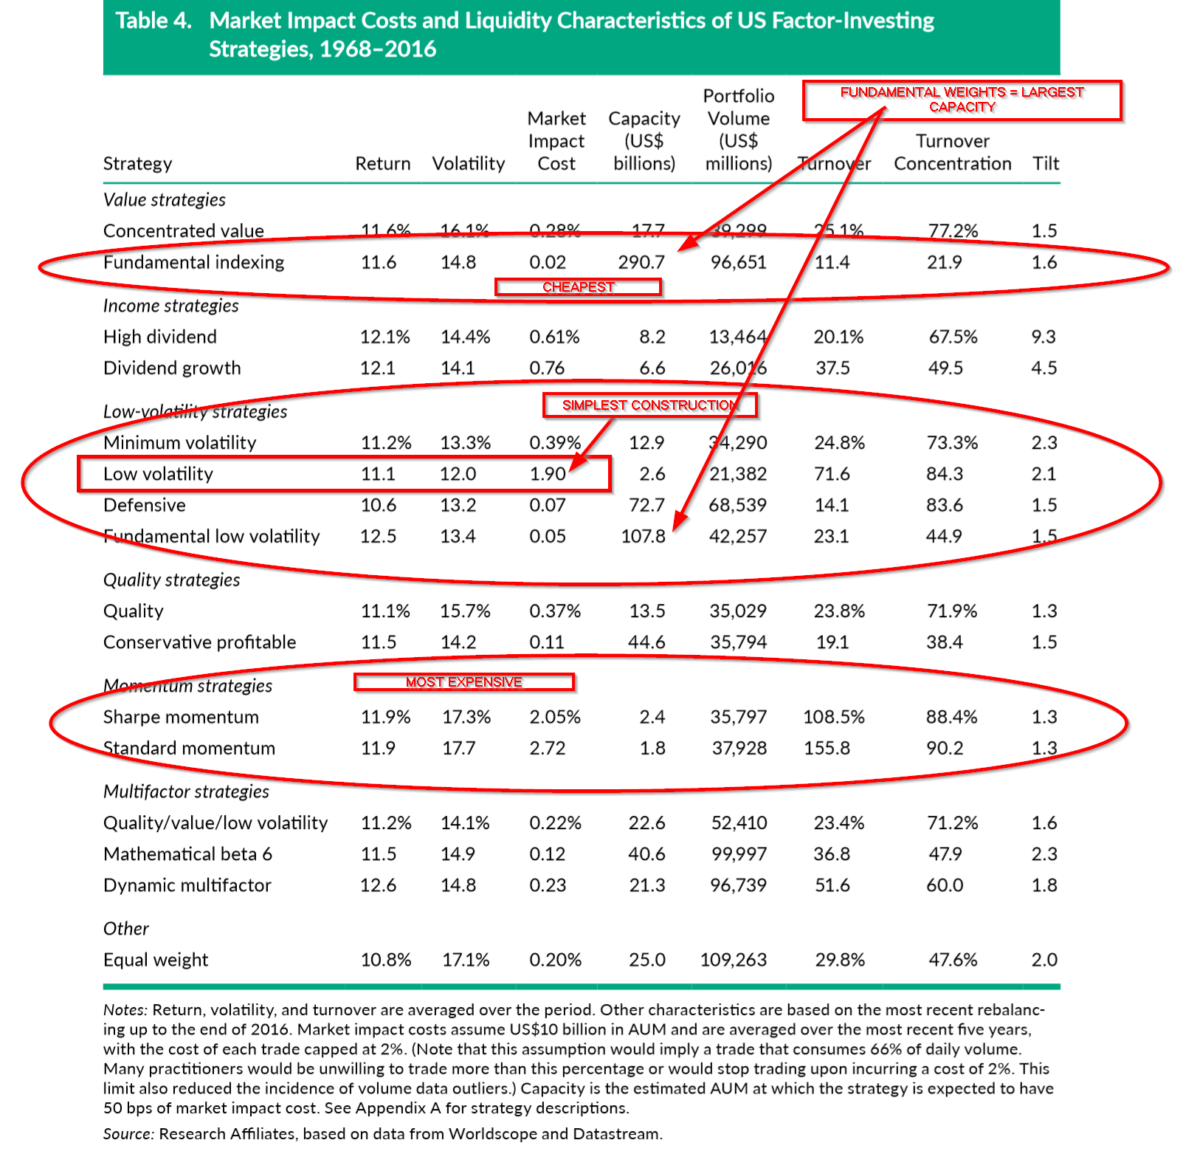
Source: Feifei Li, Tzee-Man Chow, Alex Pickard & Yadwinder Garg; Transaction Costs of Factor Investing Strategies, 2019
The results are hypothetical results and are NOT an indicator of future results and do NOT represent returns that any investor actually attained. Indexes are unmanaged, do not reflect management or trading fees, and one cannot invest directly in an index.
Abstract
Although hidden, the implicit market impact of factor investing may substantially erode a strategy’s expected excess returns. The rebalancing data of a suite of large and long-standing factor-investing indexes are used in this study to model these market impact costs. A framework to assess the costs of rebalancing activities is introduced. These costs are then attributed to characteristics that intuitively describe the strategies’ demands on liquidity, such as rate of turnover and the concentration of turnover. A number of popular factor-investing implementations are identified, and the authors discuss how their index construction methods, when thoughtfully designed, can reduce market impact costs.
- The views and opinions expressed herein are those of the author and do not necessarily reflect the views of Alpha Architect, its affiliates or its employees. Our full disclosures are available here. Definitions of common statistics used in our analysis are available here (towards the bottom).
- Join thousands of other readers and subscribe to our blog.
- This site provides NO information on our value ETFs or our momentum ETFs. Please refer to this site.
The post “The market impact of rebalancing factor investing strategies” appeared first on Alpha Architect.

