
It is Fall here in the United States, the season when leaves fall in much of the country. The warm months are slowly coming to an end; Winter follows and, as always, cannot be stopped.
Q3 2019 hedge fund letters, conferences and more
In my opinion, the economy has entered Fall and is showing signs of Winter’s approach. Like the leaves outside of my window, the economic data has already turned red and is steadily falling.
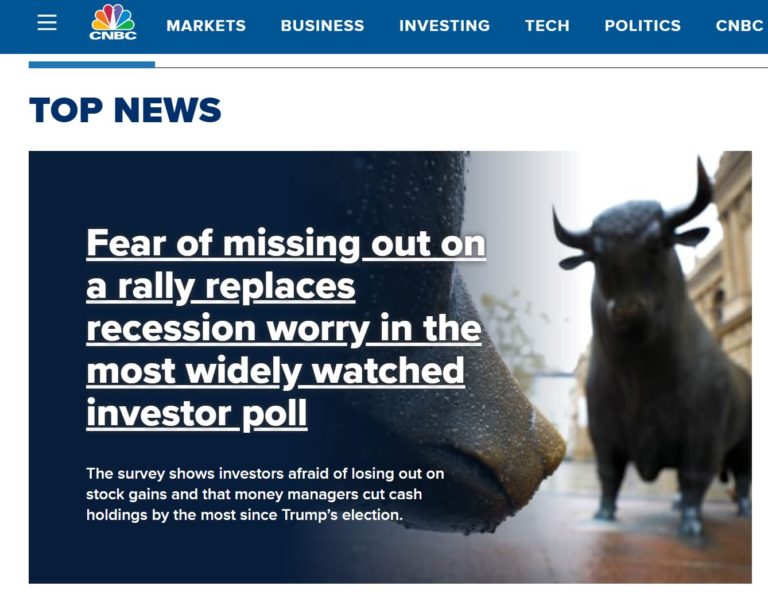
As I wrote months back, too many people have entered a too early Winter hibernation. Stock bull markets usually expire when the majority of people are bullish and not when the majority of investors are pessimistic. Right now a lot of money is still sitting on the sidelines waiting for the all clear signal and as this money enters the stock market, then stocks will obviously have to continue their upward move. “Fear of missing out” is a powerful thing.
CNBC headline on November 12, 2019:
Most stock market tops are prolonged events that ultimately experience a final blow-off period which features rapid stock market gains mixed with investor euphoria. Over the past year, I’ve watched a market top trying to form, but I have not yet seen the typical euphoric blow-off. A “blow-off” is when prices, over a period of several to many months, deviate from their true or intrinsic value. They just gyrate higher. They eventually become very over-valued (and yes, they already are becoming over-valued). So, the question this time around is this: Will we get the usual market peak blow-off? Will we get that spectacular ‘Indian Summer’ that usually shows up at this advancing late stage of the market cycle?
What would be the cause of any blow-off… melt-up… bubble? Despite the high risk and the strong probability of a near term pull-back, the effects of the three Fed rate cuts and big corporate tax cuts have not gone away, plus there will be a big (election year) incentive for President Trump to find a solution for the chaotic Trade War that he engineered. And “seasonals” (the usually strongest months of the investing calendar) have just arrived and will likely remain positive until late Spring. I do not believe that “Impeachment” will have much effect on the stock market between now and late Spring, although the S&P-500 dropped 15% when President Clinton was impeached and 25% when President Nixon resigned in disgrace.
I sent out a private email to clients in October stating that I believed that the stock market may want to gyrate higher through to year’s end or perhaps to early Spring. Despite the continued high risk, the blow-off became even more probable when the market, unlikely as it seemed, stuck its head above strong (2 year long) overhead resistance during the first week of November. Perhaps INDIAN SUMMER is here, but we must not forget that Winter is growling and snapping at its heels.
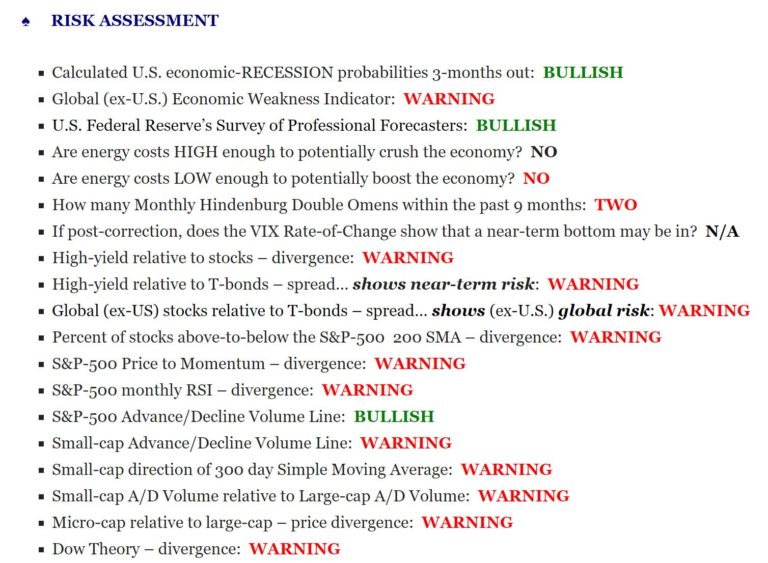
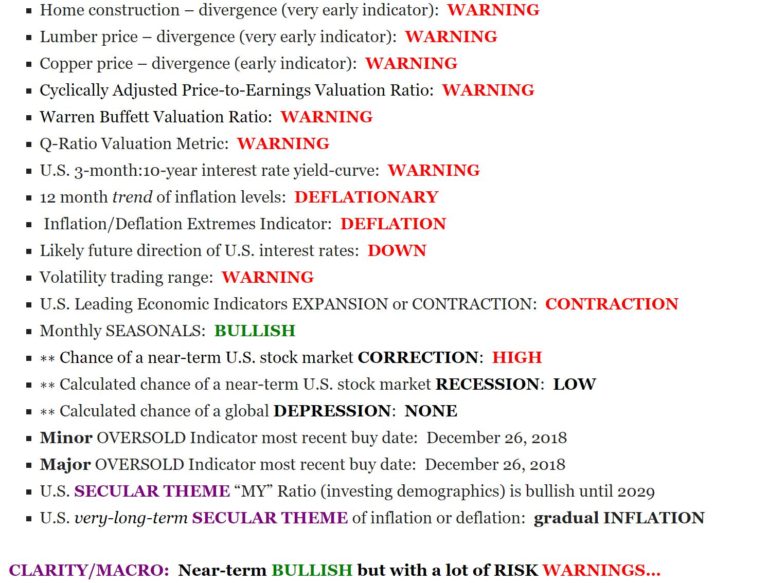
RISK doesn’t have to be an opinion or an emotion, it can be quantifiable and measurable… maybe even palpable.
As I showed in a blog posting several months ago, and again below, real risk is at extremely high levels and has been so since just before the big market drop in December of 2018. This check-list, which I re-create daily, was like a big, healthy GREEN tree from early April of 2009 until late-2018… it is now ablaze with RED leaves, showing Winter’s eventual approach. RISK is not disappearing at all, but the stock market can still go up if enough investors are bullish enough to push it up. It will only stop when the last of the smart money has sold out of their positions and no buyers remain. That is what a market top is.
Three very important economic indicators which show current (rather than leading) economic conditions are:
- Un-employment trend
- Manufacturing
- Services
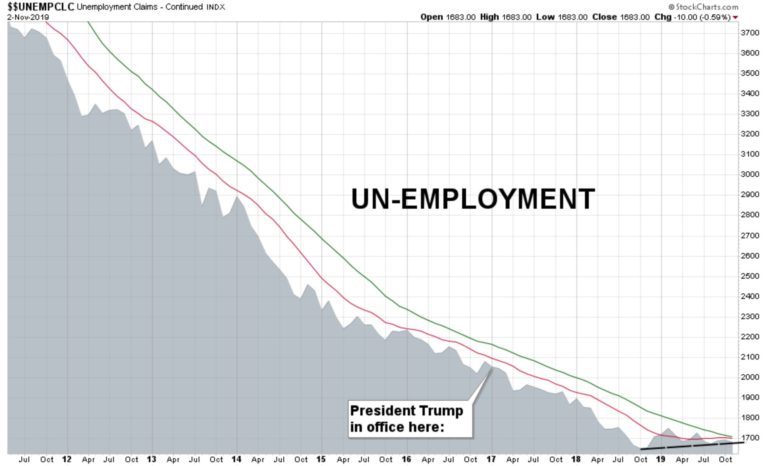
While un-employment is near record lows in the United States, the chart below clearly shows signs of a bottoming process (see black line) that started over a year ago. The un-employment trend is already beginning to indicate a change to a new upward path of increasingly weaker employment data. This will take months to play out.
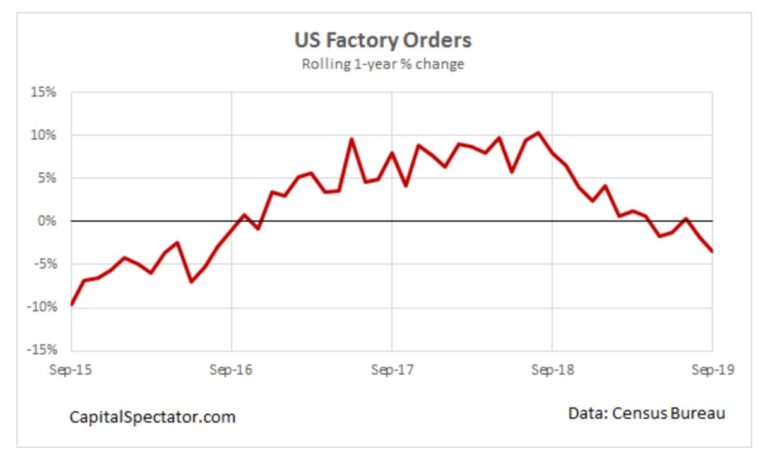
Manufacturing is weakening. Factory orders started falling over a year ago because the actual buying of manufactured products is slowly drying up. It doesn’t matter that you “make things” if nobody is interested in buying what you are making. Again, this will take months to play out.
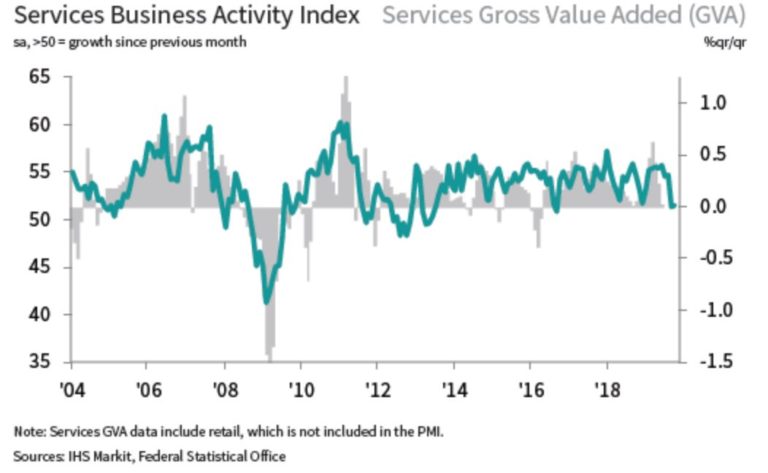
We are told that, if manufacturing is weak, then “services” will hold up the economy… but in the United States, services is also relatively weak:
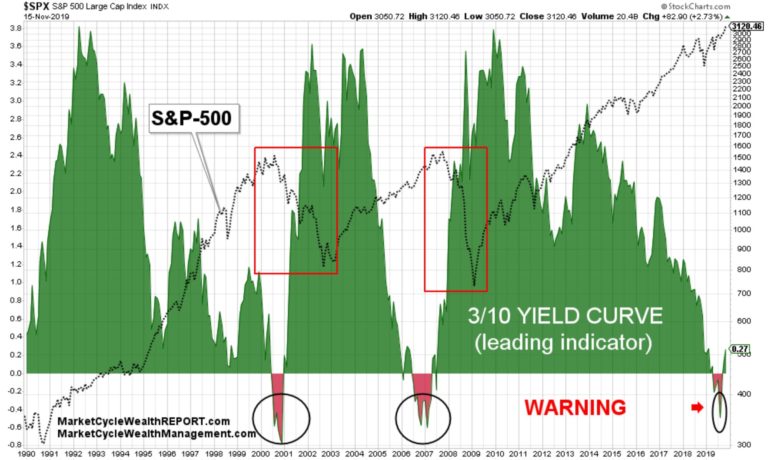
And a note on the YIELD CURVE. The yield curve has already inverted (red area) and held inverted for over three months, signaling a recession within 18 months. Then it un-inverted (back to the green area), as it always does, but the pontificators on CNBC started saying that the coast is now clear and there will be no recession. Historically it always inverts and then un-inverts, with BOTH happening before recession hits (as evidenced via prior episodes as shown on this chart). The Federal Reserve’s own extensive data strongly points to a U.S. economic recession starting in the late-Spring of 2020.
SUMMARY: Risk is still extremely high and we are still experiencing a downward deflationary spiral, but investor euphoria might send the market gyrating higher over the coming months. Relative strength is still with the United States, but a push toward value positions may give a slight boost to global equities. MarketCycle is currently positioned to survive any market reaction… up, down or sideways. It is possible that the 2 year sideways consolidation pattern (that just ended) let off enough pent-up steam for the market to gyrate higher for longer. If so, some of our risk indicators would go back to green and we would increase our cyclical asset positioning accordingly; we will follow our proprietary investing system with complete fidelity. But right now risk is very high and our ‘any scenario’ portfolio positioning is still paying off ‘bigly.’
Literally everything at which we look says that we are still in the second half of the late-stage of the repeating market cycle… and if risk is abnormally high and valuations are stretched and the entire global economy is weak and the Central Banks (including the Federal Reserve) are frightened but stocks keep grinding higher, then we might have an eventual problem.
WHAT CONFUSES ME? Calculated recession probabilities 3 months out is now back below 7%. Over 65% of investors believe that a recession will occur in 2020. Under normal conditions, this would mean that there will be no recession in 2020 since the majority is always wrong. But as I’ve written, it is quite possible that we get NO recession and, instead, get an eventual plain-vanilla bear market. A “bear market” is a pull-back of > 25% with no concurrent economic recession; a soft landing.
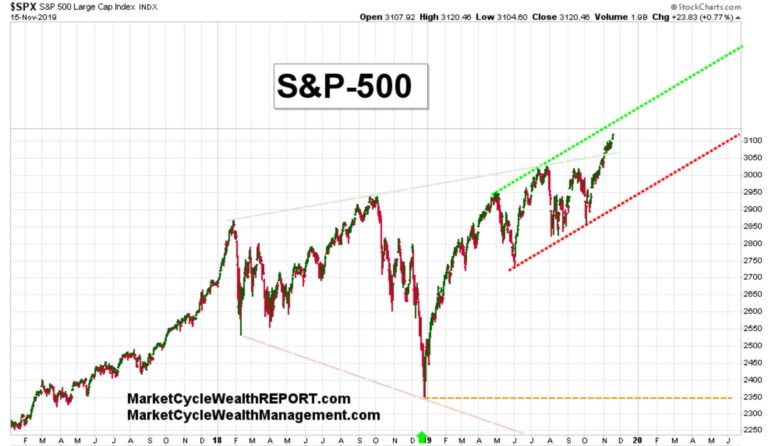
WHAT HAS CHANGED? The 2 year long bearish megaphone pattern (faded lines as shown below) negated during the first week of November and a brand new bullish trend-channel now becomes the most likely trading pattern. As I’ve said before, much of technical analysis only works because traders see a chart or historical pattern, in mass, and then trade in such a way as to make it play out as expected, as a sort of “self-fulfilling prophecy.” For at least 90% of technical analysis, there is no other logical reason for it to work. So, when I personally mark lines on a price chart, it is only because I want to know (ahead of time) what the millions of technical analysis traders across the globe might see and then react to. Since technical analysis practitioners are such a large group and since they so often react together, like a school of fish, MarketCycle wants to be able to exploit their market activity.
WHAT’S NEW? The chart pattern of the S&P-500 seems to have morphed into a new trend channel (green and red dashed lines). The trend channel’s narrowness implies that it won’t survive forever.
SUMMARY of SUMMARY: It’s the late-stage of the market cycle and it contains current high risk and the potential for high volatility. Despite the strong probability of a near term pull-back, we have also likely entered into a bullish period that might last for longer than expected, depending on how much pent-up steam has been released during the past two full years of sideways stock market gyrations. Right now, while the crowd may get a bit euphoric in the coming months, we shouldn’t get too overly excited unless measurable risk levels drop dramatically.
FUN FACT, just to cheer you up: A new Bank of America – Merrill Lynch study found that automation and robotics will replace half of all jobs (of almost all types) worldwide within the next 15 years. Think about that; in a mere 15 years half of the planet may be unemployable.
Thanks for reading! If you like what we do, please tell others. You can do this via links on our website.
SUBSCRIBE to this free, monthly, no spam blog via the website.
SUBSCRIBE to our paid member daily MarketCycle Wealth REPORT via the website.
MarketCycle Wealth Management is in the business of safely navigating your investment account through rough waters. It is easy, affordable and the first 3 months are at no charge. Professional management does not cost… it pays… it pays for itself.

