New data from the Citco group of companies’ (Citco) – the asset servicer with over $2 trillion in AUA – most recent data, reveals that hedge funds achieved one of the highest monthly inflows of recent years, at $6bn.
All-in-all, the vast majority of funds are in the green, with 80% of Hedge Funds administered by Citco achieving positive returns in May 2025, with a weighted average return of 3.2%.
Highlights:
- Equities funds led the way with a weighted average return of 4%. This was followed by Multi-Strategy funds at 3.2%.
- Commodities funds were the only negative strategy type, returning -1% for the month of May.
- All funds by an Asset under administration (AUA) basis came in positive. The largest funds returned the highest amount, with funds over 3bn returning 3.6%, followed by 1bn-3bn at 2.3%.
- Inflows followed the strong momentum from this year, reaching $6bn overall, with subscriptions of $17.4bn, outweighing redemptions of $11.4bn.
- Rate of return spread dipped slightly as the difference between 90th and 10th percentile fund returns fell to 8.9%, down from 9.6% in April.
- Regional capital flow: Funds in the Americas had the highest net inflow ($7.9bn). European funds ($4.8bn) and Asia ($0.3bn) both saw smaller positive net inflows in May.
- Treasury payments processed by Citco dipped in May, however they remain in record high territory, with another month of over 50,000 payments (56,248) processed.
Executive Summary
Performance
Hedge funds delivered the second-best monthly return of 2025 in May, with nearly 80% of funds in the green, amid a bounce-back across markets as fears over the impact of trade tariffs eased.
Funds administered by the Citco group of companies (Citco) achieved an overall weighted average return of 3.2%, with nearly all strategy types in positive territory and 79% of funds delivering positive returns. May’s monthly return was only topped by January’s figure of 4%, and takes the year-to-date (YTD) weighted average return to 7.1%.
Equity strategies were the top performers in May, with a weighted average return of 4%, followed by Multi-Strategy funds at 3.2%, and Fixed Income Arbitrage strategies at 2.1%. Event Driven (1.4%) and Global Macro strategies (1.1%) were also positive, while Commodities strategies were in the red for the month with a weighted average return of -1%.
Across the Assets under Administration (AUA) categories, all AUA buckets saw positive performance. The largest funds with more than $3bn of AUA achieved a weighted average return of 3.6%, followed by the $500m-$1bn category at 3.1%. Funds with between $1bn-$3bn of AUA, and the $200m-$500m category, both saw weighted average returns of 2.3%, while the smallest funds with less than $200m of AUA had a weighted average return of 1.5%.
The rate of return spread – the difference between the 90th and 10th percentile fund returns – dipped marginally to 8.9%, down from 9.6% in April.
Capital Flows
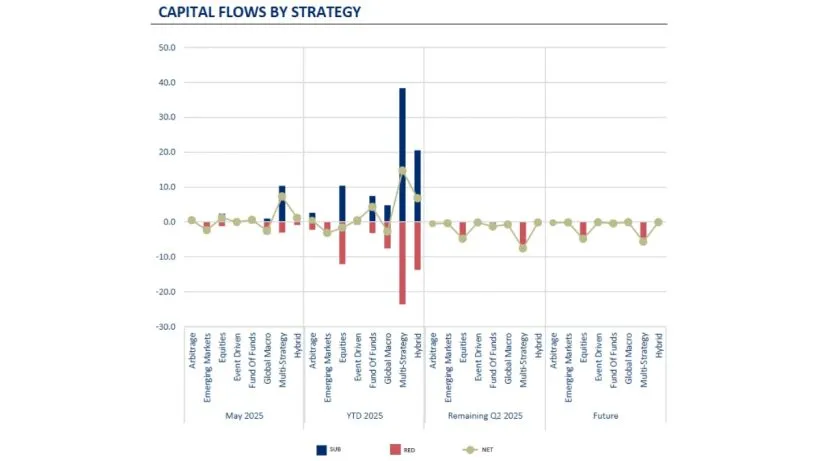
Hedge funds attracted the highest net inflows of the year in May, continuing the positive momentum seen so far this year, with the majority of strategy types seeing net inflows.
Net inflows stood at $6bn overall in May, one of the highest monthly inflows in recent years, as subscriptions of $17.4bn outweighed redemptions of $11.4bn.
Continuing the trend seen for much of this year, Multi-Strategy funds were a focal point for investors, with $7.3bn of net inflows in May, taking them to $14.7bn YTD. Equity and Hybrid strategies both saw net inflows of $1.2bn in May, while Fund of Funds strategies came in at $0.6bn, and Arbitrage funds saw net inflows of $0.5bn. While the majority of strategies saw net inflows, Global Macro strategies had $2.5bn of net outflows, alongside Emerging Markets strategies at $2.3bn.
On an Assets under Administration (AUA) basis, funds with between $5bn-$10bn of AUA had net inflows of $5.3bn in May, their highest inflows YTD. Meanwhile, the $10bn+ of AUA category saw net inflows of $1bn in May, and the smallest funds with less than $1bn of AUA had net inflows of $0.8bn. Funds with between $1bn-$5bn of AUA had net outflows of $1bn.
The latest flows mean that YTD, the largest funds with more than $10bn of AUA have had net inflows of $14.2bn, while funds with between $5bn-$10bn of AUA stand at $7bn. The other two categories have seen small net outflows.
On a regional basis, funds in the Americas saw the highest net inflows of $7.9bn in May, taking them to $14.9bn YTD. Funds in Europe, which had strong net inflows in April, saw this reverse in May, with net outflows of $2.1bn, leaving them with $4.8bn of net inflows YTD. Meanwhile, funds in Asia had net inflows of $0.3bn, but they remain negative YTD, with net outflows of $0.3bn.
Navigating Market Volatility – How Citco Can Help
Understanding what your fund is exposed to at the touch of a button, and how it is expected to behave in various market conditions, can be invaluable any time, but especially when volatility spikes.
By gaining a comprehensive understanding of fund exposures, leverage, currency hedges and performance all in one place, alongside the ability to perform scenario analysis, funds can better navigate the challenges posed by an ever-changing financial landscape.
Citco Portfolio Analytics provides all these solutions, helping clients understand and analyse their funds more effectively. The interactive dashboard provides ready-to-use analytics on portfolio exposures, performance attribution, and scenario analysis and stress tests for current and past periods, providing additional perspectives on the current market environment.
To learn more, please click here.
Performance

Overview of Investor Flows

Read the full report here by Citco