
Activist short-seller Muddy Waters’ new short report questions the financial prospects of Inogen (INGN), a provider of portable oxygen for patients.
Q4 hedge fund letters, conference, scoops etc
“You gonna believe me, or your lyin’ eyes?” – Richard Pryor
Muddy Waters is short Inogen, Inc. (INGN) because we believe management has created an egregiously false narrative about the Total Addressable Market (“TAM”) size and growth. We estimate that the U.S. market is 1.3 million users. The data shows us that the market is actually shrinking. We believe that even though POC penetration will continue to increase, INGN will hit peak sales no later than next year.
INGN embodies much of what is dysfunctional about today’s capital markets: Misleading statements by management, shoddy market research presented as authoritative, thorough sell-side capture, and of course significant enrichment of insiders through stock sales. The key to INGN’s extreme multiple is its blue-sky story – namely that its U.S. TAM is approximately three million users and growing at 7% – 10% annually. INGN presentations often state both estimates, which are the work of an obscure research firm called WinterGreen Research, Inc. These estimates appear to have little grounding in reality. We reviewed the 2017 WinterGreen report, and frankly feel it is middle school student quality, replete with misspellings, poor grammar, bizarre statements of fact, and even outright plagiarism from the New York Times. As we write this, it’s hard not to laugh thinking about how many serious analyst reports and company presentations have been prepared effectively based on this work. INGN management should know better than to take WinterGreen’s work as authoritative.
We calculate the real U.S. TAM is presently approximately only 1.3 million users, which is 57% lower than management’s claim. Our estimate is derived from Centers for Medicare & Medicaid Services (“CMS”) data. CMS data also shows the oxygen therapy market has been shrinking. We estimate that from 2010 to 2017, the market shrank at a CAGR of -2.6%. This is a far cry from the estimates of 7% – 10% positive growth the company has been making since November 2013.1 In our view, management has created a false narrative by presenting poorly-sourced estimates along with misrepresenting data from credible sources.
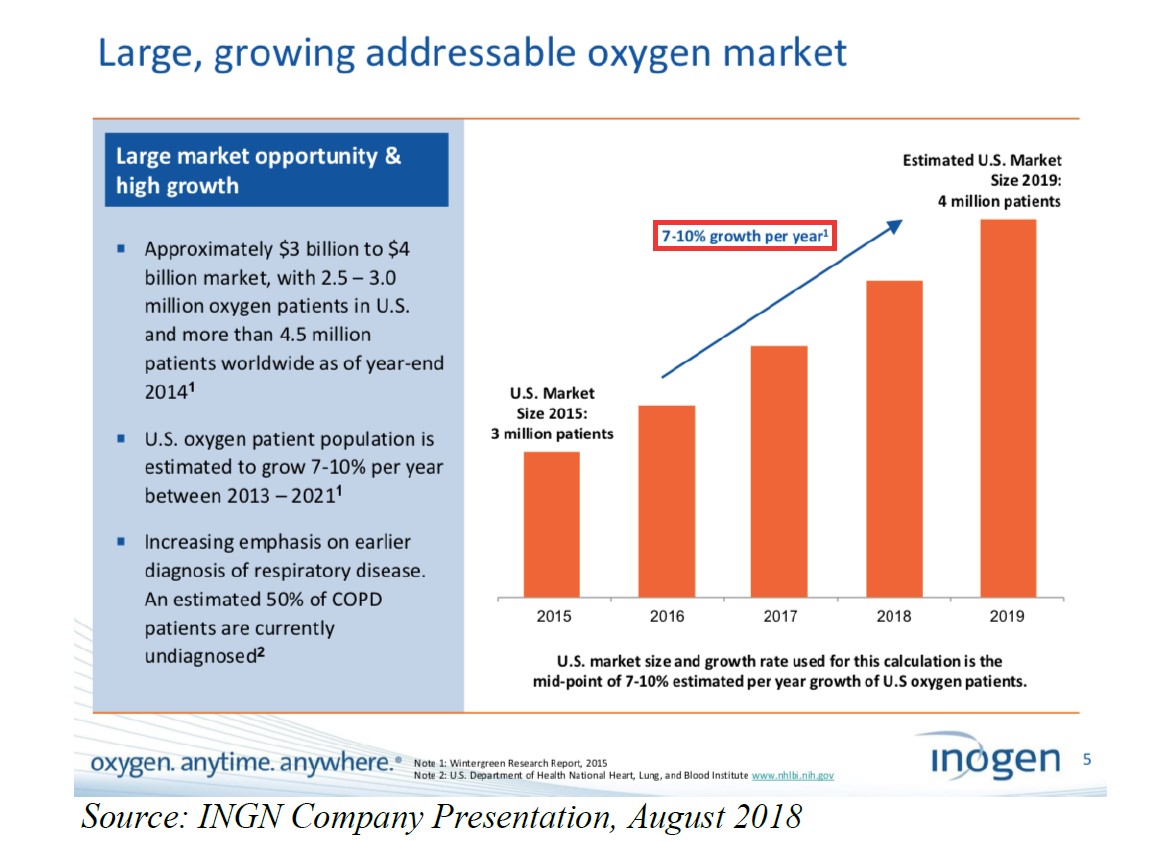
It appears that management became aware of investor concerns about its market estimates late last year.2 As recently as November 2018, INGN’s investor presentation contained a slide with the estimates of a three to four million user TAM growing at 7%-10% annually.3 But since then, management has either de-emphasized or entirely stopped presenting these poor estimates. Those same slides, which had consistently been in investor presentations since at least 2015, were removed from presentations given on January 9 and January 16, 2019. Therefore, we believe that management is now engaged in a lowkey CYA exercise.
The thoroughly captured sell-side is picking up the slack though. Analysts are still trumpeting three million user TAM / 7%-10% growth despite these issues. The sell-side effort to justify is so blatant that one analyst – in order to endorse the notion of a three-million user TAM – presents calculations that actually average dollars spent on one hand with the number of users on the other. In other words, averaging apples with oranges.
The problems with INGN’s blue sky story don’t stop there, however. INGN management states that the potential penetration rate among ambulatory oxygen users is 90%, which is significantly higher than the rates other sources provide. In other words, management’s potential penetration rate estimate, regardless of the true TAM, appears extremely optimistic. One recent industry report presents an overwhelming consensus (approximately two-thirds) stating that portable oxygen therapy is appropriate for up to only half of ambulatory oxygen therapy users. Compounding the problem, INGN seemingly overstates the percentage of oxygen users that are ambulatory. It claims 73% are ambulatory, but this appears to be an erroneous reading of CMS data; in our view, the proper reading of the data yields an ambulatory share of 67%.
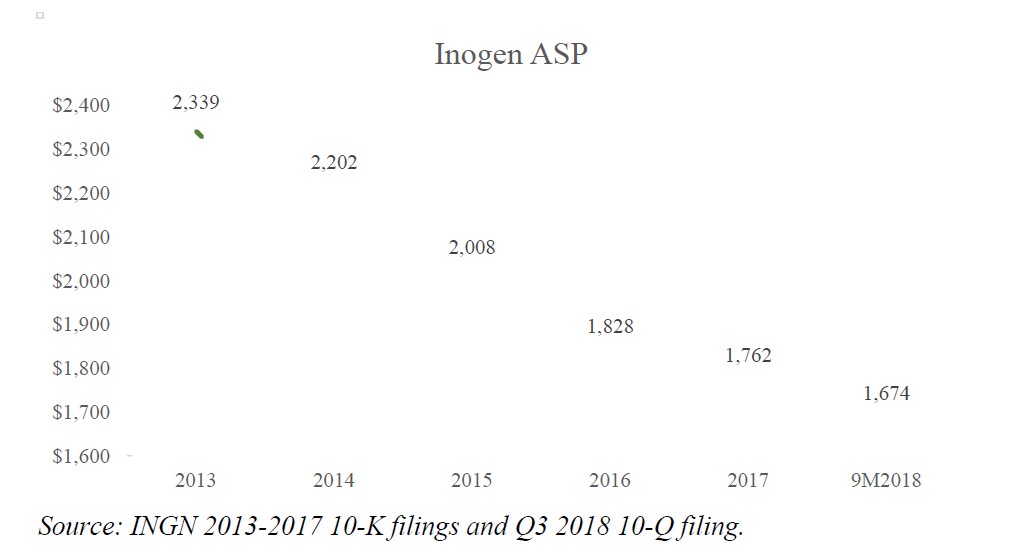
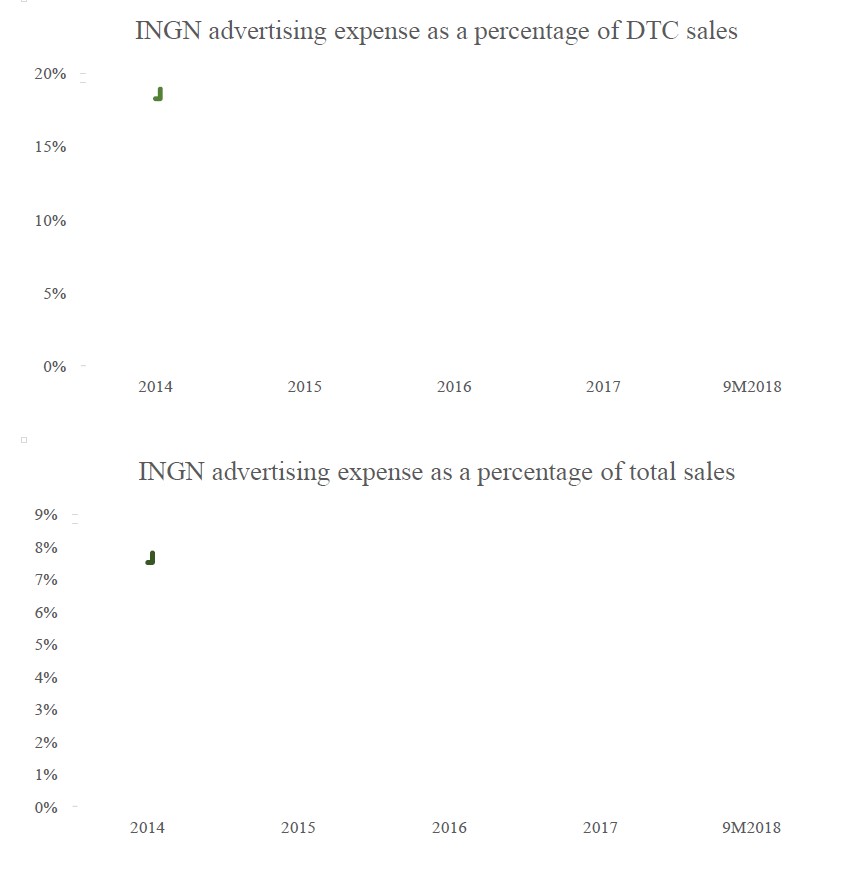
We believe the limitations of the market are showing up in INGN’s financials right now, and that INGN will be at peak revenue either this year or next. INGN boosted its Q3 2018 gross margin by 177 bps by reducing two provisions. Without these shenanigans, gross margins would have declined YoY in Q3 2018. We see the compressing gross margin as evidence that reported growth has been much harder to generate than investors perceive, as opposed to the apparent view of a company floating on a rising tide. The higher cost of growth is also pressuring the EBITDA margin. Since 2016, the company’s advertising expenditure as a percentage of revenue has risen from 3.1% to 7.8% through Q3 2018. (Advertising spending as a percentage of revenue was largely steady during 2014 through 2016.)
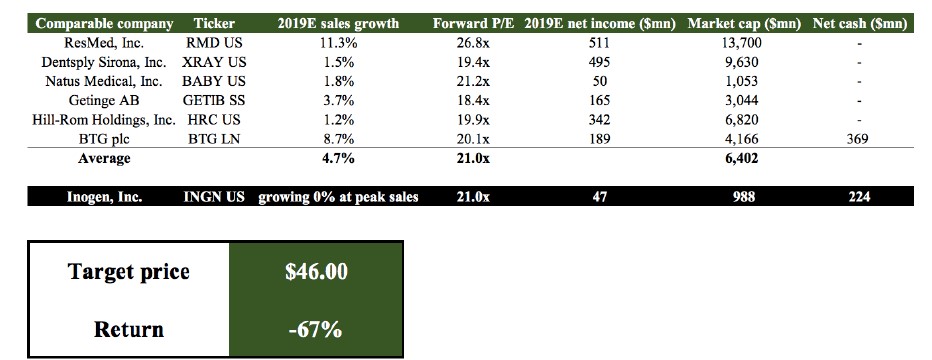
We expect INGN sales to peak no later than next year. While POC penetration rates should continue to rise, the mix of B2B sales likely imposes a significant barrier to further growth. POCs sold to B2B customers have an estimated six-year usable life, meaning that each is likely to serve multiple users in its lifetime.4 We see China as unlikely to materially change the picture for INGN. Accordingly, we think INGN is reaching peak sales in 2019 or 2020. There is no justification for an 8x sales multiple, let alone any valuation based on a sales multiple. At our forecast of peak earnings, we value INGN at $46 per share, a 67% decrease from its current price.
Management’s TAM Estimates Are Likely More than Double the Real TAM.
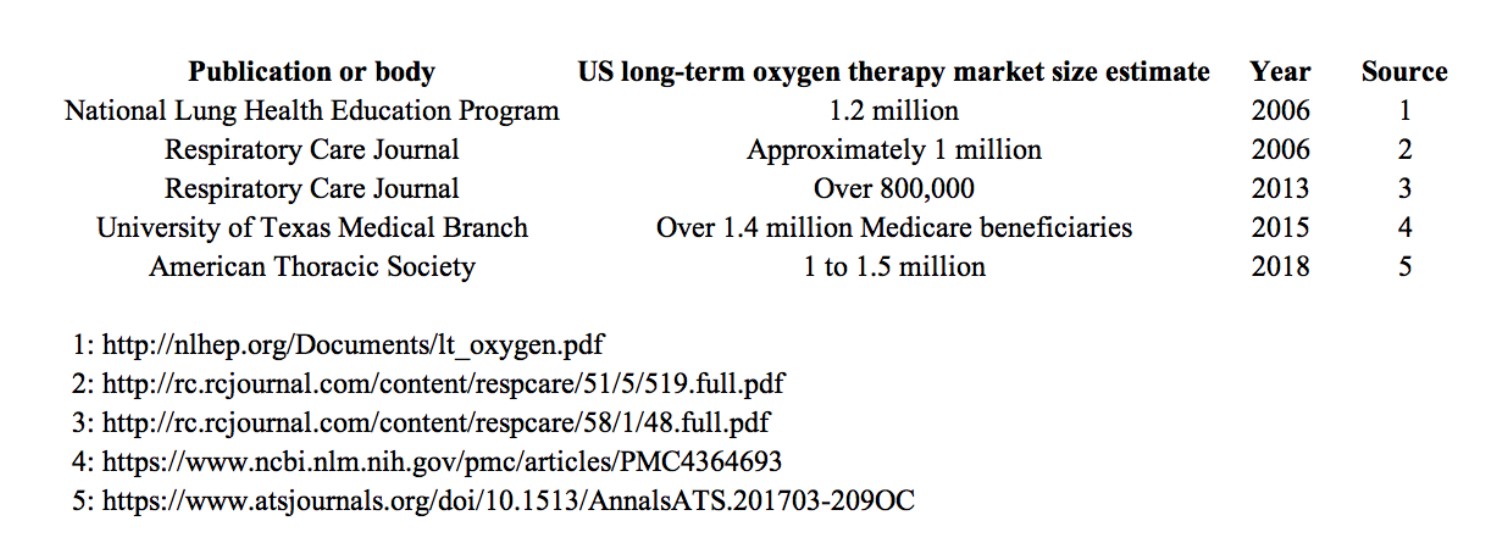
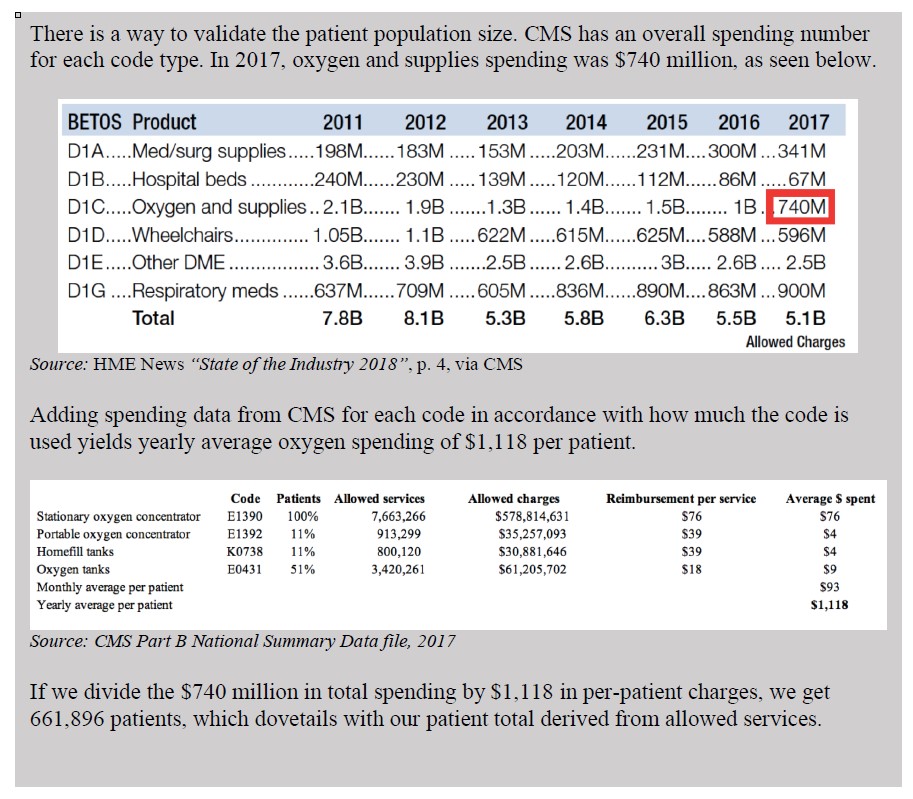
Using CMS data and information from INGN, it is straightforward to calculate a 2017 U.S. oxygen therapy market of approximately 1.3 million users. This is 57% lower than the WinterGreen / management estimate of three million users. The key in analyzing CMS data is that the total number of users in a given year overstates the market at any given time due to users ceasing therapy (often due to death). In addition, some patients “cap out”, which we take into account in accordance with INGN’s methodology. We therefore calculate the average number of services for which CMS reimbursed through dividing the annual numbers by 12. We then gross these numbers up according to INGN’s guidance – adding 18% for those users “capped out”; and then grossing up for the 40% of users INGN management claims are not covered by Medicare. Our estimate is consistent with those published in five different studies or articles.
Management’s claims related to market size and growth largely rest on highly questionable estimates from a company called WinterGreen Research. We reviewed the 2017 WinterGreen report, and were flabbergasted that this work has served as the basis for TAM size and growth estimates the company and analysts use. One of our favorite statements from the report was its claim that one growth driver of the market is federal judges who will use oxygen therapy to work past age 100. Due to the materiality of this work to the INGN growth narrative, we discuss the report in more detail in our report. The bottom line is that we see no way to get close to the three million users that management cites.
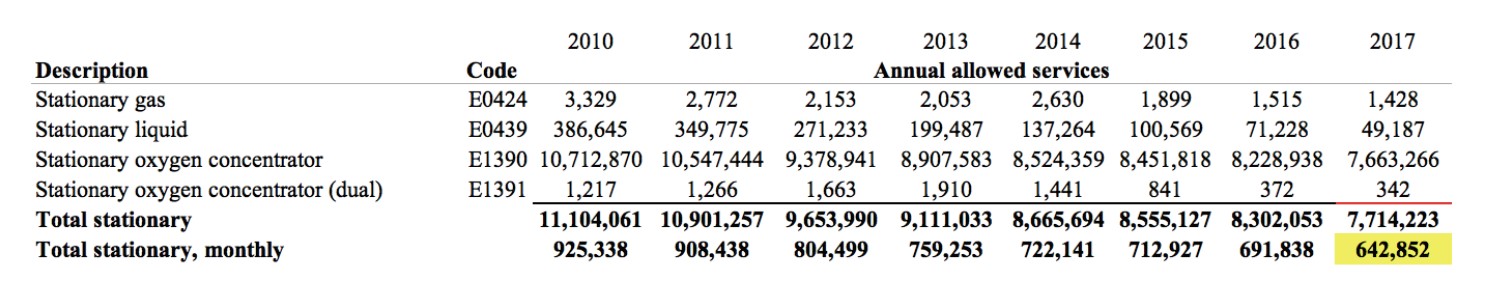
To develop a reality-based TAM estimate, we started with CMS’s number of monthly stationary oxygen reimbursements for 2017. There were 7.71 million “allowed services”. Each time Medicare allows a monthly reimbursement for a stationary oxygen concentrator, this counts for one monthly service. Dividing this figure by 12 will provide us with the average number of reimbursed patients under all stationary codes. The average number of patients per month using oxygen is then 642,852.
Note that allowed charges are a better proxy to use than the number of Medicare beneficiaries because Medicare beneficiaries overcounts. Classifying a person who uses oxygen therapy for six months in January and then dies and another person starting oxygen therapy in July as two beneficiaries significantly overstates the population of oxygen therapy users over a 12-month period.
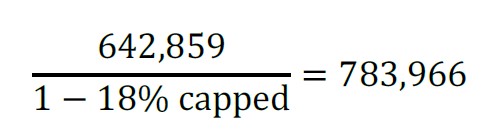
We then adjust for patients that are outside of the “cap period”. This is a patient population that is still using oxygen therapy, but has been on it for over 36 months, which no longer entitles their suppliers to a Medicare reimbursement, other than for filling tanks.5 We adjust by the 2018 capped percentage management gives: 18%.6
We account for “capped” patients by adding back in the 18% of patients that are outside of the cap, according to management. Dividing average monthly patients (642,852) by 82% yields a total Medicare patient population of 783,966:
INGN management state that 40% of users are not captured by Medicare because they have either Medicare advantage or private insurance.7 Therefore, we divide the total Medicare patient population (783,966) by 60%:
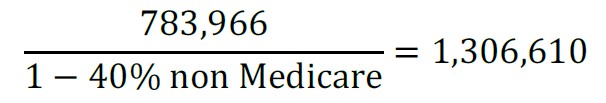
Adjusting the CMS allowed services figure by the proportion of non-Medicare patients results in a 2017 oxygen therapy patient population estimate of 1.31 million. Therefore, using INGN’s own methodology, management has overstated the size of the US market by more than 100%.
At least five published articles or studies support our estimate.
Falling Tide: The U.S. Oxygen Therapy Market is Not Growing; Rather, it is Already Shrinking.
CMS data shows declining numbers of approved services between 2010 and 2017. However, INGN has avoided admitting the market is shrinking by stating that the difference between overall positive and negative CMS growth is due to users switching to Medicare Advantage. INGN management references Medicare Advantage data from the Kaiser Family Foundation (“KFF”) when they make this point. The KFF data shows Medicare Advantage enrollment growing each year, with the implication apparently being that when including Medicare Advantage users, the market growth is positive – if not robust. However, we checked the math. The KFF data actually contradicts management’s assertions. The oxygen therapy market is actually shrinking, meaning that the company’s claim is greatly misleading.
Combining the KFF and CMS Part B National Summary data shows that the total market for oxygen therapy has declined by -16.7% from 2010 to 2017.
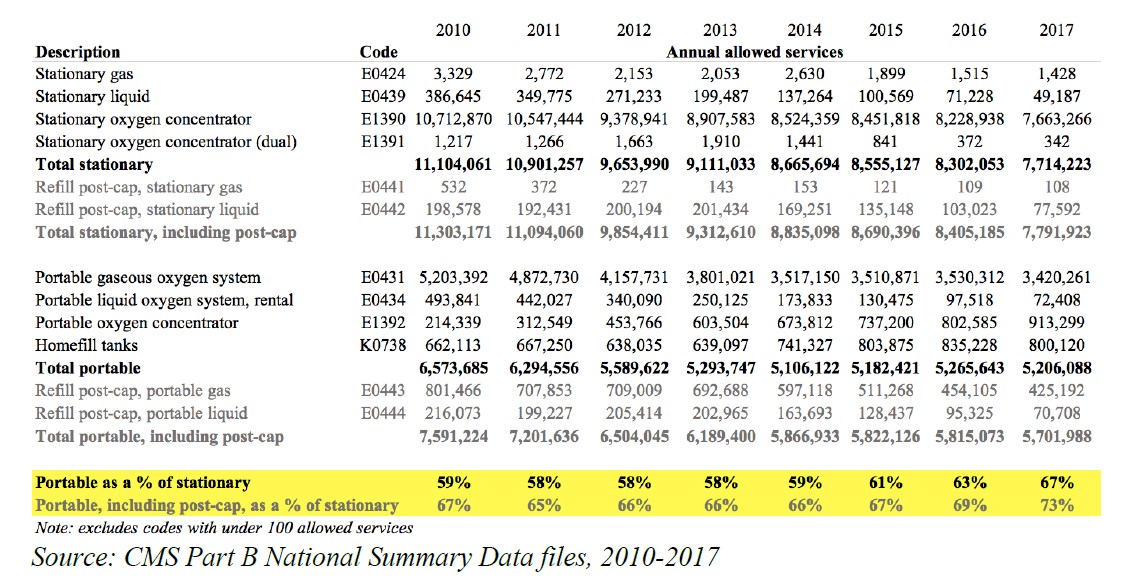
Below is each stationary reimbursement code. Adding the corresponding allowed services together, adjusting by capped patients, and then adjusting by the proportion of Medicare Advantage patients, we still get a -2.6% annual decline in the number of oxygen patients. By doing three elementary-school division problems, we again disprove the growth narrative.
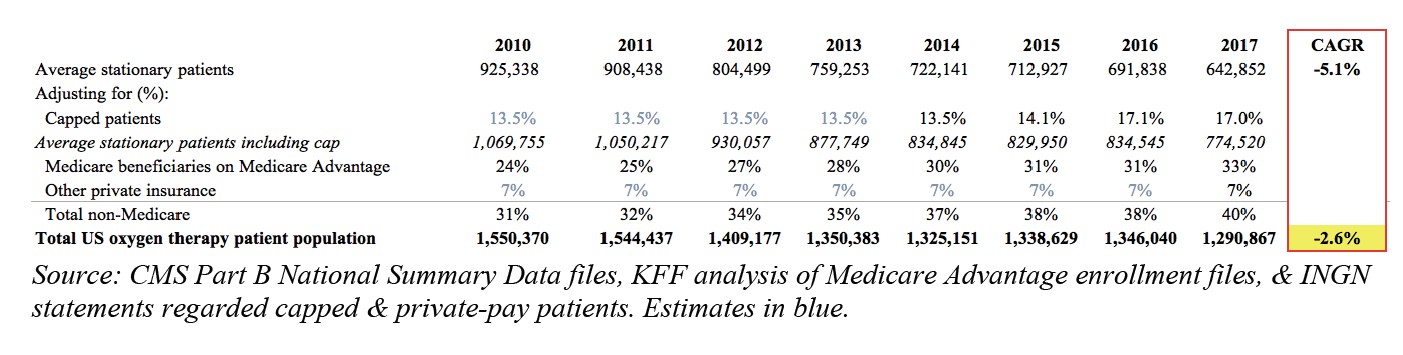
Our above analysis directly contradicts management, who have attempted to downplay CMS data as a tool for understanding market growth.8 The company’s misdirection via Medicare Advantage actually only explains away half of fall in oxygen patients each year, and it does not in any way reveal growth.
Management’s Misstatements of TAM and Growth Appear Intentional. We Note that Management Has Sold Over $145 Million of Stock on the Back of These Misrepresentations.
Management recently appears to have distanced itself from the TAM size and growth estimates, which we believe validates our estimates and shows management is aware it has spread misinformation. Management might think relying on WinterGreen Research’s estimates gives them plausible deniability. We see little plausible in the estimates. Moreover, management have also been misrepresenting data from the World Health Organization. With INGN management suddenly silent on the key elements of the blue-sky story, it has been left to the co-opted sell-side to push the false narrative.
Is a Quiet CYA Campaign Afoot?
Until recently, INGN’s management have consistently pushed the narrative that the US oxygen market is between three to four million patients and that the market is growing 7% to 10% annually. As JP Morgan noted in a December 2018 report, some investors had begun asking questions about the claimed TAM. And in two conference appearances this January, management has not mentioned the 7% to 10% growth estimate that they provided as recently as November. This strikes us as a quiet attempt to backtrack. Below is the November 2018 mention:
“The oxygen therapy market in the USA, it’s three to four million oxygen patients. The growth is rather robust at 7% to 10% net growth annually.” Scott Wilkinson, INGN CEO, at the Stifel Healthcare Conference in November 2018.
The below slide touts the same oxygen therapy market growth rate that INGN asserted since the IPO. However, we have been unable to find this claim in investor presentations given since November.
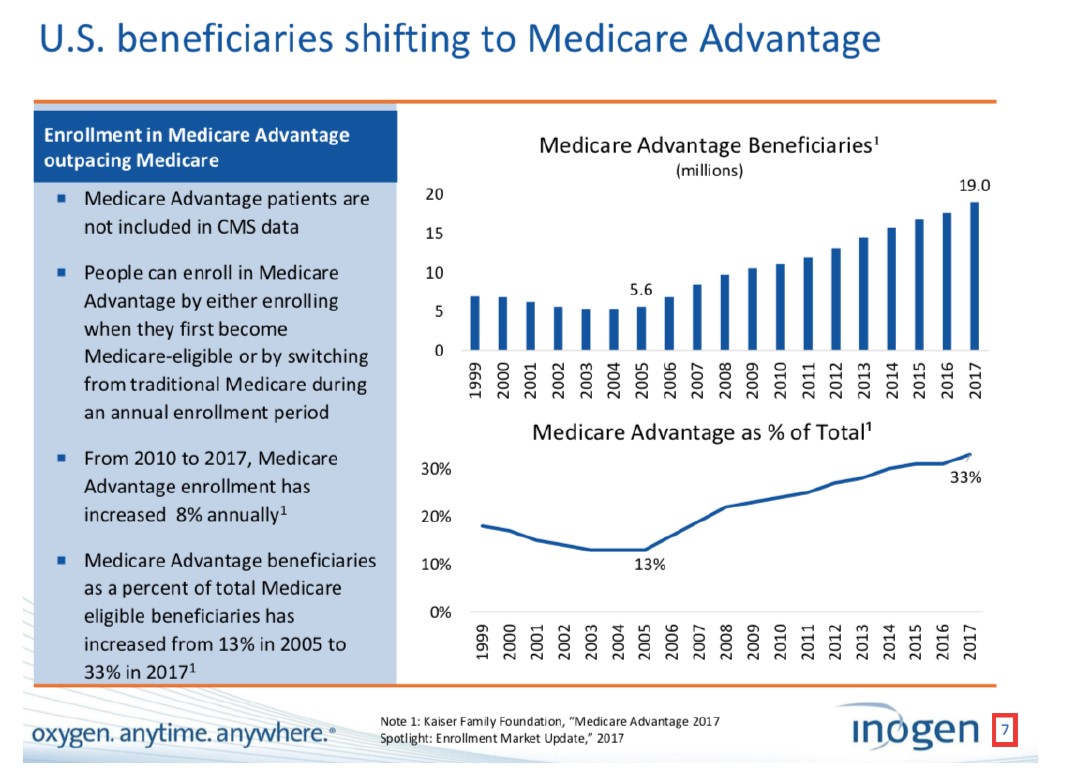
In fact, at their most recent investor conference on January 16, 2019, management managed to go through an entire presentation without mentioning the growth of the oxygen market, which we believe is a first for INGN’s executive team. Unfortunately, management is still attempting to obscure the fact that the total market is declining. The recent disappearance of the line about 7% to 10% growth came in conjunction with management’s new narrative: U.S. beneficiaries are shifting to Medicare Advantage, and therefore analysts cannot gauge the oxygen market’s growth by looking at Medicare data alone. (Our previously shown calculation contradicts these assertions.) Referencing the slide below, management told investors in January 2019:
“Over the last 10 to 15 years of patients moving from the pure Medicare program into the Medicare Advantage programs. And so those patients migrate out of that bucket, the migration rate is fairly robust. It’s 8% annually. And you see that the percentage of Medicare beneficiaries or Medicare folks that are eligible—or should I say patients that are eligible for Medicare—has grown in the last 10 years from about 13% to 33%.”9
At the same time, management used the narrative pivot to continue to justify their growth claim (emphasis added):
“And due to that migration from the Medicare bucket to the Medicare Advantage bucket, you actually see if you look at the Medicare bucket in a vacuum that it looks like it’s shrinking because some of the key codes, the stationary oxygen concentrator Code E1390 actually is going down year-over-year. And it’s not because the pool is shrinking, it’s because people are migrating over to that other bucket. So, you’ve got to look at it in totality to really understand the dynamics of the market.”10
Contrast the above statement with management’s assertion just two months prior, in November 2018 (emphasis added):
“I would also like to comment on the recently released Medicare data from CMS for the full-year 2017. While the CMS information has some limitations when used to assemble a picture of the oxygen therapy market such as the absence of brand or manufacturer information, we believe that the information can serve as a proxy for the entire oxygen therapy market.”11
INGN is talking about the exact same data set in both statements, but management has taken a much more skeptical view of CMS data since removing its 7% to 10% growth claim from their presentation.
Similar to the inconsistencies that crop up in a false story told multiple times, INGN’s past descriptions of the market size have at times contradicted one another. In a November 2013 filing, INGN describes an “approximately $4 billion” oxygen therapy market in the U.S., based on 2011 Medicare data and “our estimate of the ratio of the Medicare market to the total market”.12 They describe a market of about three million U.S. patients growing at 7%-10% from 2013 to 2019, with five million patients globally. Less than one year later, management began claiming an approximately “$3 billion to $4 billion market” in the U.S., based on new Medicare data.13 The market now had “more than 2.5 million patients”—still growing at 7% – 10% (of course)—and “more than 4.5 million patients worldwide”.
In January 2016, management was back to three million patients, although still with a $3 billion to $4 billion market.14 Net-net, the company had not even returned to its pre-IPO market claims in over two years, despite claiming the same inspirational growth figures throughout. Another layer of confusion presented itself in 2016, when management was citing WinterGreen Research in its presentations to back up these patient and dollar figure claims,15 even though in SEC filings, INGN was simultaneously attributing the market sizing to its own extrapolations from Medicare data16. This begs the question of who actually formulated the estimates in the WinterGreen reports.
Geriatric Judges on Oxygen and 150-Year Olds: Inside WinterGreen Research’s 2017 Report
We suspect management would have a hard time explaining their choice of WinterGreen Research’s reports to support the growth narrative they’ve told since the IPO. WinterGreen’s 2017 report on the oxygen therapy market is riddled with typos and would charitably be described as “amateurish”. (WinterGreen’s first report on the market that INGN cites was published in 2012).
We contacted WinterGreen Research and were interested to learn that it is able to turn around market research reports on new industries within one week. We present some of the more interesting tidbits from the 2017 report.
Included in the patient groups that likely would use oxygen therapy:
“Brainworkers and students demanding fatigue releasing and relaxation after hard work” and “Laborers and players needing relieving oxygen-lacking symptoms after exercise”.17
Further into the report, WinterGreen suggests the growth in oxygen therapy will be propelled in party by oxygen therapy’s healing powers; however, we found the supporting arguments to contain no factual support (typos and grammar reproduced from the source document):
“Stationary oxygen concentrator markets will grow as people buy more portable oxygen concentrators and need stationary units to compliment the realize the value of mobile supplemental oxygen for almost any medical condition. The casinos have realized the value of oxygen for their clients, and believe that this helps people feel better.”18
“There are many reasons the markets may get an infusion of marketing dollars. For one, the pharmaceutical companies having trouble developing new drugs, they have begun to turn to medical devices. What better device than an oxygen concentrator to develop new markets.”19
Insight regarding 100-year-old federal judges:
“After all, federal judges in their 70s and 80s have learned that if they ply their bodies with oxygen they can work well into their 100’s. This is pretty good.”20
Literal vaporware – oxygen products that have not yet been invented:
“So it may be that with the aging of the population whole new markets are found. This is what the current fairly aggressive forecast assumes, that there will be a burst of new marketing dollars into this segments that drives significant growth with products that have not even been invented yet, products that are used by well people to increase wellness.”21
The mathematically impossible 150-year-olds:
“There were about 65,000 people age 100 or older in 2000, and the number of centenarians is projected to grow quickly so that there are projected to be 421,000 by 2030. Prudential Insurance is projecting that people will live to be 150 years old by that time.” 22
As far as we are aware, Prudential insurance never projected that people will live to be 150 years old by 2030. The oldest person currently alive, Kane Tanaka, would only be 127 in 2030.23 WinterGreen seems to have misinterpreted an advertising campaign that Prudential ran!

A portion of the plagiarized New York Times article (shown in the China opportunity portion of the WinterGreen report):24
New York Times
WinterGreen – note the copyright notice25

Other Management Misrepresentations
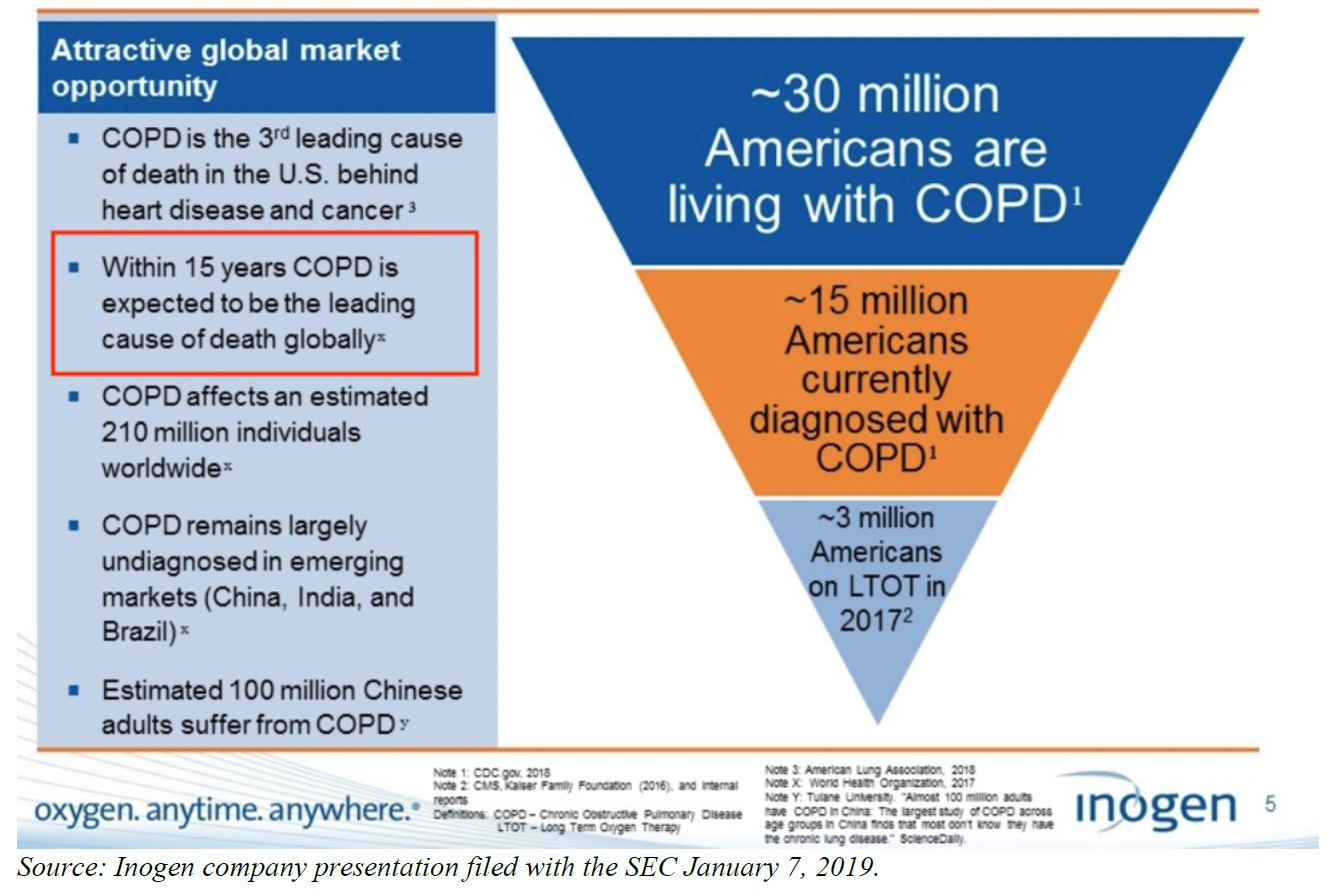
INGN management also misrepresents data from the WHO on the size (present and estimated) of the chronic obstructive pulmonary disease (“COPD”) population. As part of the growth story, INGN management seemingly would like investors to believe that COPD sufferers are increasing in number, or that they at least represent a significantly larger market opportunity than the one INGN presently serves.
In the below slide, management claims that the World Health Organization (“WHO”) expects COPD to become the leading cause of death by 2034. That is not true. Rather, the organization predicts COPD will be the third leading cause of death. When queried about INGN management’s statement, a WHO representative stated that management’s statement was “most likely a mistake”.26
Most patients on oxygen therapy suffer from chronic obstructive pulmonary disease (“COPD”). COPD is a chronic inflammatory lung disease characterized by limited airflow from the lungs. It is caused by long-term exposure to irritating gases or particulate matter, most often from cigarette smoke.27
However, the disease is less prevalent than it used to be in the U.S., especially among the elderly, who tend to be prime candidates for oxygen therapy. A 2015 study found that in the time between two federal surveys conducted in 1998-1994 and again in 2007-2010, there was a five-percentage-point drop in the proportion of 60- to 69-year-olds that had airflow obstruction.28 The prevalence of severe airflow obstruction shrank as well, from 6.4% to 4.4%, which gets to the heart of one of the limitations of the POC market opportunity. Only a distinct minority of patients in the more advanced stages of COPD need oxygen therapy. The vast majority of patients do not. Sell-side analysts have eaten up INGN management’s COPD narrative along with the other fairytales, penning bullish reports touting the “Robust, Long-Tailed Sales Growth Story”.29 But there are problems with INGN’s claims.
In the same slide above, management claims the WHO stated that approximately 30 million Americans are living with COPD. This is an extremely misleading statement. The WHO states 16 million Americans have been diagnosed, with millions more undiagnosed. The CDC estimates that approximately 15 million Americans have been diagnosed with COPD. The CDC notes a study with data collected between 1988 to 1994 concluded that approximately 50% of COPD patients were unaware they had COPD prior to diagnosis.30 Even using the CDC information as a basis to double the estimate of diagnosed patients is greatly misleading because even if we extrapolate pre-internet age data to today, it does not mean that for every one diagnosed sufferer in the U.S., there is another one who has not been diagnosed.
Sell-Side Capture
As much as we criticize sell-side research, we would be the first to state it is several notches above the quality of WinterGreen’s work. Therefore, we find irony – if not humor – in seeing the confidently expressed analyst models that are effectively based on WinterGreen’s estimates.
These models, which are based on flawed foundations, justify bullish target prices. The consensus target price amongst the seven analysts covering INGN is $239, 71.0% higher than where it trades today.31
How exactly do analysts get to ~3.0 million long-term oxygen patients in the U.S. if the real amount is 1.3 million? As it turns out, in consultation with management, they use three layers of numerical manipulation to torture out a figure that is 2.5x the size of the actual patient population.
One analyst starts out by referencing 1,427,220 Medicare patients using oxygen and supplies in 2015. That would be fine if the source document, the 2016 CMS Statistics Booklet, said anything remotely similar. Instead, the figure the analyst cites represents allowed charges in thousands of dollars.32 That’s not a typo—what the analyst called 1.43 million oxygen patients was actually $1.43 billion in oxygen spending.
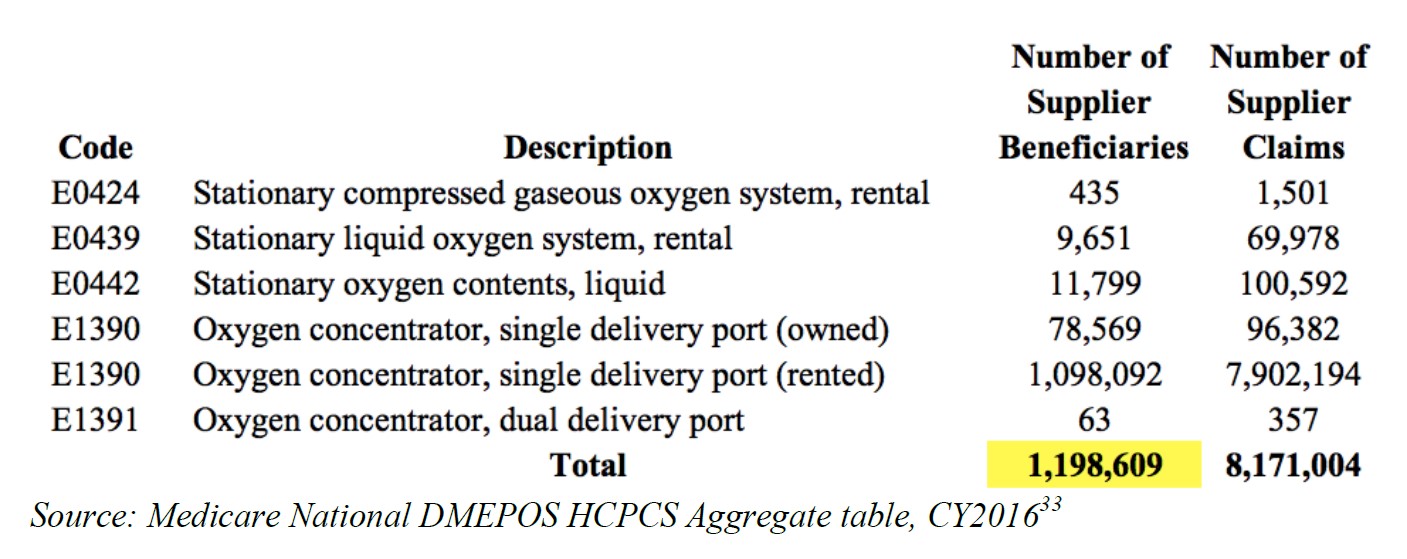
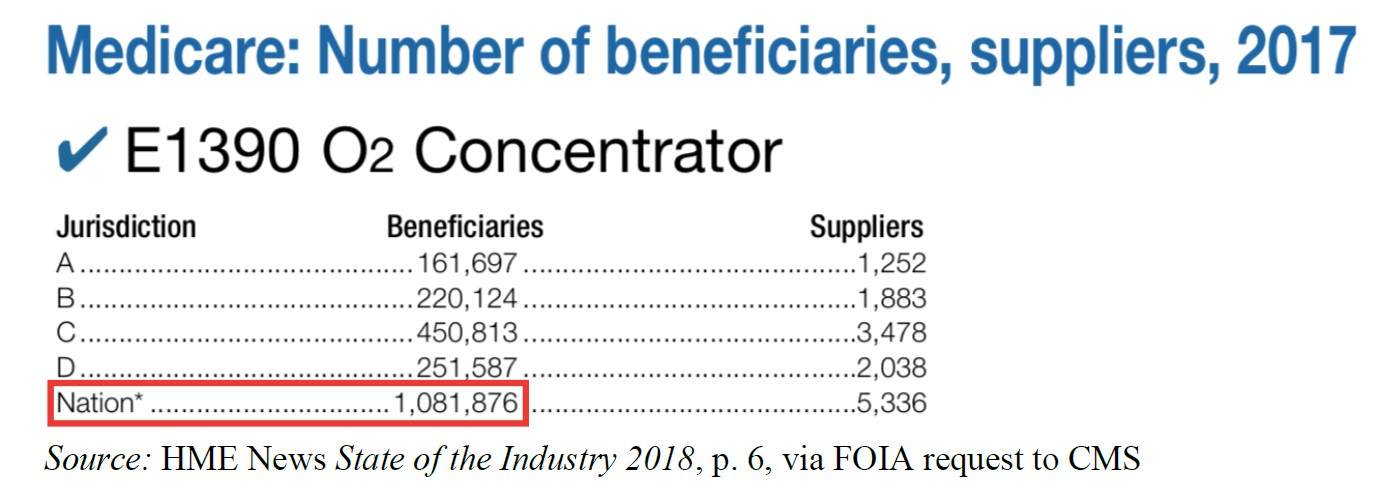
There are also Medicare data points that are much more attractive—i.e., actually relevant—for a company looking to exaggerate the size of the patient pool. In 2016, there were 1.20 million oxygen beneficiaries nationwide. This number counts oxygen patients who died in the early part of the year, as well as people who started using oxygen toward the end of the year. As a result, it significantly overstates the number of patients on oxygen at any given time.
Setting aside the fact that including EO442 is double-counting patients and counts patients beyond the cap, the analyst’s calculation starts with an enormous delta to the true figure and only gets larger. The analyst inexplicably averages the 1.20 million with the 1.43 million obtained by misreading the CMS Statistics Booklet. To illustrate the magnitude of the difference in starting point, the correct 2016 monthly Medicare patient figure for the stationary oxygen code is 684,822. From the already inflated 1.20 million, the analyst’s calculation adds back an overly generous 25% of capped patients, rather than INGN’s own 17.1%.34 Adjusting for the 40% of Medicare Advantage or private-pay patients, this time from “Inogen and its many years of internal data”, and adding in an estimated 19,000 units sold for cash got the analyst to 2.9 million. The calculation is reproduced in its absurdity below:
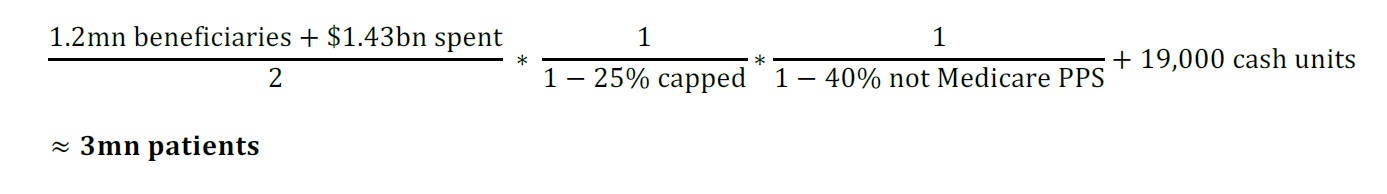
Creativity points are in order here for going beyond the call of duty in stretching to the company’s three million figure.
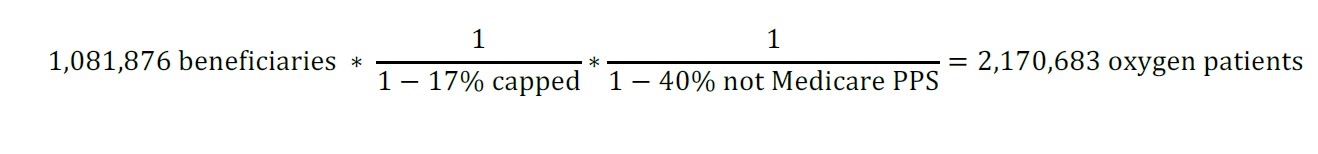
Other analyst estimates rely on a beneficiary number that trade publication HME News makes available every year via a FOIA request to CMS. That number shows 1.08 million beneficiaries; however, it suffers from the same methodological flaw. A patient who died halfway into the year and another who started oxygen therapy halfway through the year are counted twice.
Adjusting this inflated number for capped patients and Medicare Advantage or private insurance yields 2.17 million oxygen patients in 2017. It is well short of three million, but it seems that by backdating the patient number to 2016 or 2015, fiddling with the percentage of capped patients, or adding generous cash-pay numbers, analysts manage to match the fictitious three million that management puts forward.
INGN’s Estimate of the Full Penetration for POCs is Aggressive When Compared to Analysis Using Industry Surveys and CMS data.
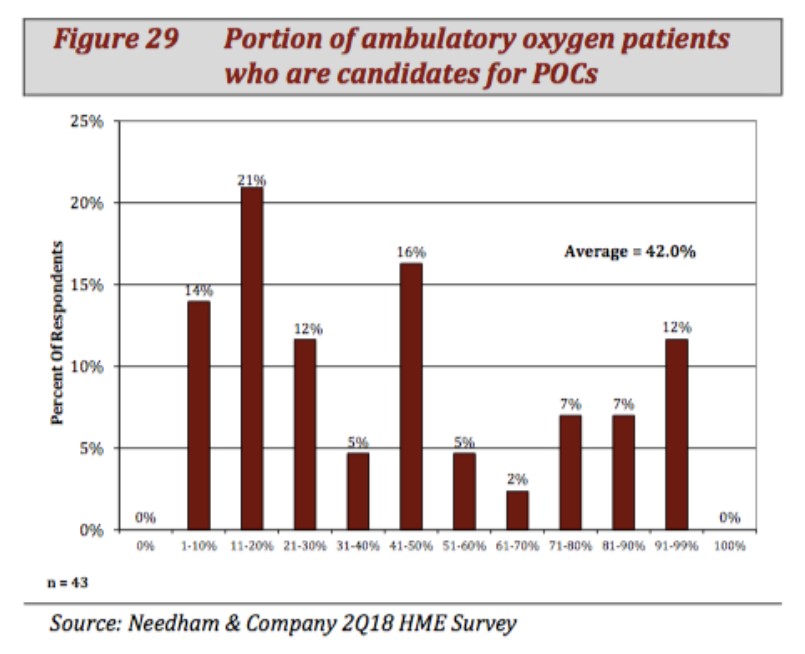
INGN management’s claim that 90% of ambulatory patients are potential POC users seems greatly unrealistic. This is well in excess of the estimates of two industry sources with whom we spoke. A June 2018 Needham & Co. and HME News survey also implies INGN’s estimate is overly optimistic.
Many ambulatory patients are not feasible potential users because they are healthy enough that they only need oxygen therapy while they sleep, and POCs do not have sufficient battery life to make them convenient to use overnight. Others with more advanced lung disease that can still get around or out of the house need a strong, continuous flow of oxygen, which POCs cannot provide.
As shown in the graph below, a Q2 2018 survey by Needham & Co. asking home medical equipment companies the opportunity size for POCs resulted in 68% of responses estimating that no more than 50% of ambulatory oxygen patients are candidates for POCs. Only 19% of respondents thought 81%+ of this population are candidates for POCs. One homecare with whom we spoke estimated a potential POC penetration rate of 70% of the ambulatory population.
Regardless of the proportion of the ambulatory population that are candidates for POCs, we believe INGN management overstate the share of the oxygen therapy market that is ambulatory. As shown on the below slide, INGN cites 73% as being ambulatory. We believe INGN made a counting error, and that the actual number is 67%.
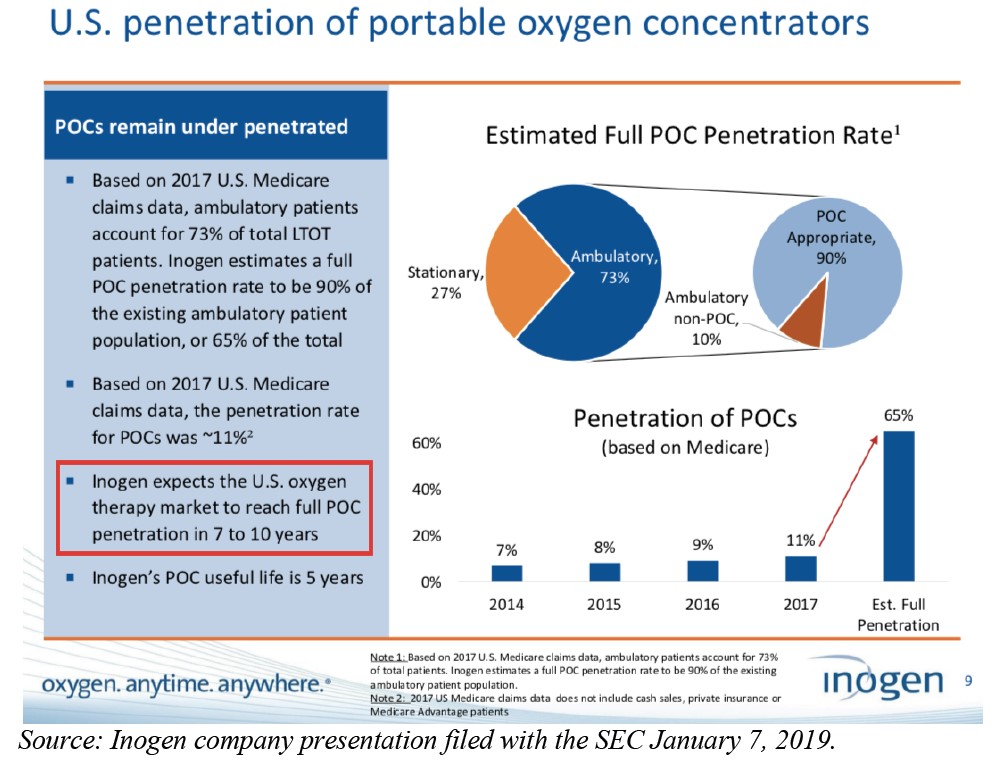
INGN’s assumption that 73% of patients are ambulatory, and therefore POC-eligible, is likely incorrect, which calls the credibility of the 65% saturation claim for POCs on the above slide into question. We believe INGN have double counted a Medicare billing code that is not appropriate for an “apples to apples” comparison. Instead, we think that ambulatory oxygen therapy patients are 67% of the total.
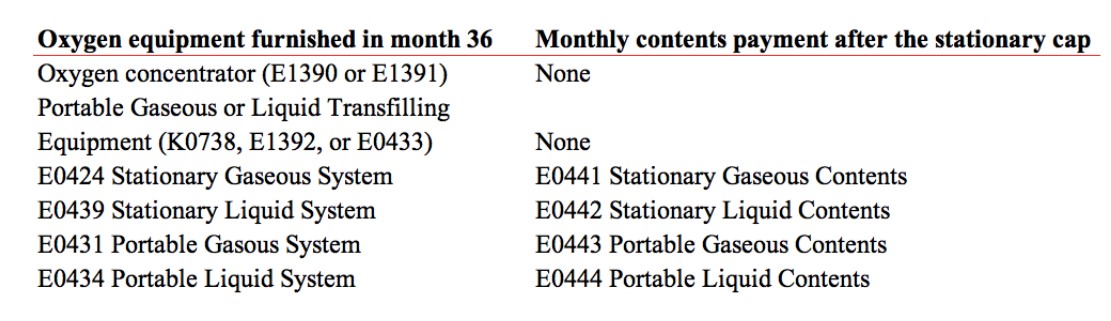
Above, we have the Medicare codes for stationary and portable oxygen. The methodology for calculating the total number of ambulatory versus stationary market is simple: take the sum of all the ambulatory codes provided and divide by the sum of the stationary codes.
INGN’s likely error, which we have shown side by side with the correct calculation, is to include Code E0441 through E0444 in its calculation of ambulatory and stationary services. These codes are for refill of oxygen tanks after the 36-month cap. This is a period when Medicare will only reimburse for refill of tanks, not a POC, making it far less likely that a patient on Medicare will purchase a POC in such a period. This brings the addressable proportion of ambulatory patients down to 67%.
Because 67% of oxygen patients are ambulatory, this further discredits INGN’s 65% peak penetration claim. In other words, 65% penetration would imply that 97% of ambulatory patients are suitable for oxygen; given POCs’ technical limitations, we think that assertion would be aggressive.
We See INGN Peak Sales Occurring in Either 2019 or 2020 at Approximately $400 million. We see Peak Profitability of Less Than $50 million.
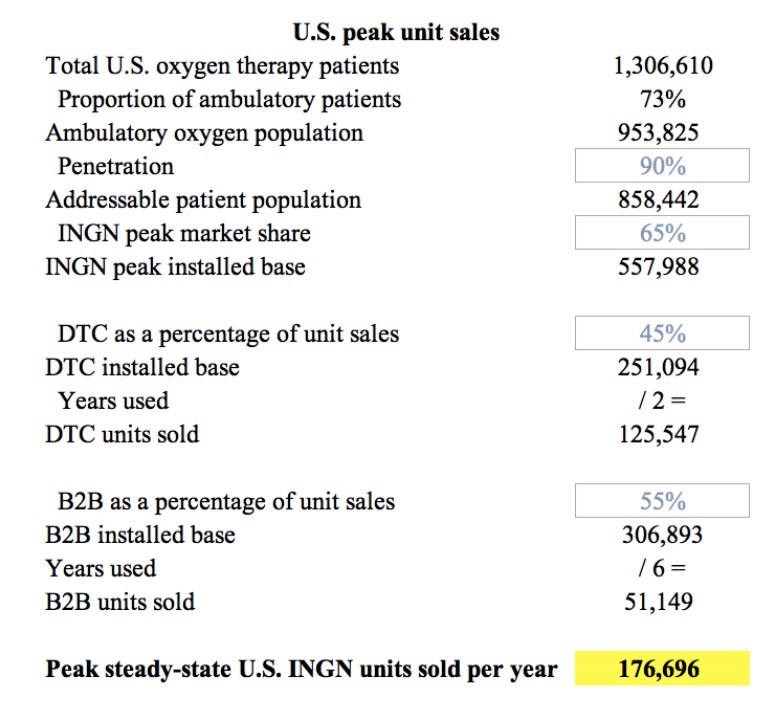
If we incorporate these downward revisions into our earlier forecasts, it is possible that the total potential installed base is between 610,000 and 784,000 units. Even under generous assumptions, this implies peak sales of 175,000 units in the U.S.35 The company stands to hit this total by 2019, because it is only 15% above the estimated 152,000 concentrators INGN sold in the US in FY 2018.
While the total market for POCs may not fully saturate for years to come, focusing on this as a single data point overlooks the purchasing schedule of the B2B and the DTC channels. INGN’s POCs have a product life of around six years.36 This means that B2B customers will be purchasing far less frequently than those in the DTC channel. Given the dynamic of deflationary pricing and lower Medicare reimbursement, B2B customers who are currently using tanks or stationary compressors are unlikely to upgrade their entire fleet of oxygen therapy devices ahead of the existing replacement cycle.
Generously assuming that no secondhand market exists for a ~$2,200 piece of medical equipment — which it does — DTC retail customers are likely to purchase every two years, consistent with the average life expectancy of a patient using a POC.
Even after crediting INGN with a 10% increase in market share and ignoring the cannibalization of higher-margin DTC sales by increasing B2B sales, which management have admitted is going to occur, INGN is close to revenue saturation.37
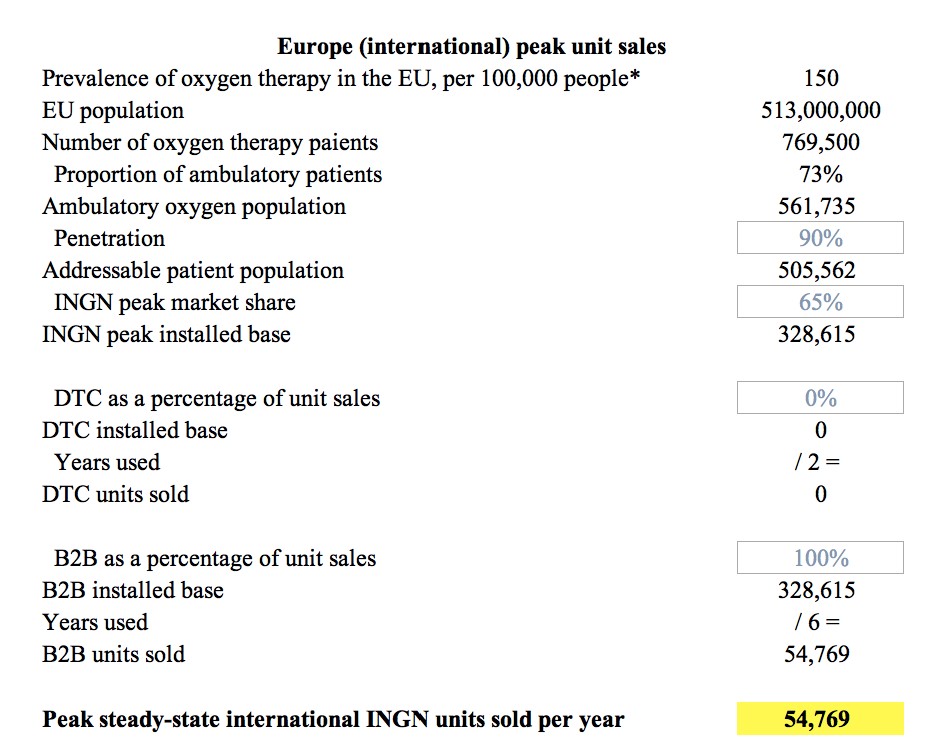
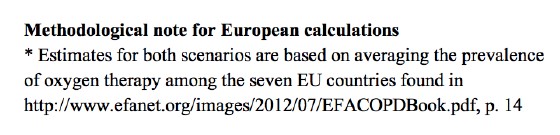
Our calculations below illustrate how INGN sales peak around total annual unit sales of approximately 231,000. 55,000 of this figure comes from Europe, which accounts for the vast majority of INGN’s international business38, while the remainder comes from the U.S. While INGN does not break out unit sales by segment, the rough D2C vs. B2B unit split can be derived from sales figures combined with list prices.
This peak sales figure is achievable this year, even under milder assumptions.
We believe management’s constant repetition of the seven-to-ten-year process for full conversion to POCs on slides, which discuss low levels of penetration, is an attempt to paint the company as a long-term growth story.
Based on current sales forecasts, INGN is likely to hit its saturation point between 2019 and 2020. Once that happens, the company goes ex-growth and will significantly de-rate.
INGN Is Employing Accounting Gimmicks that Mask the Recent Decline in Gross Margins.
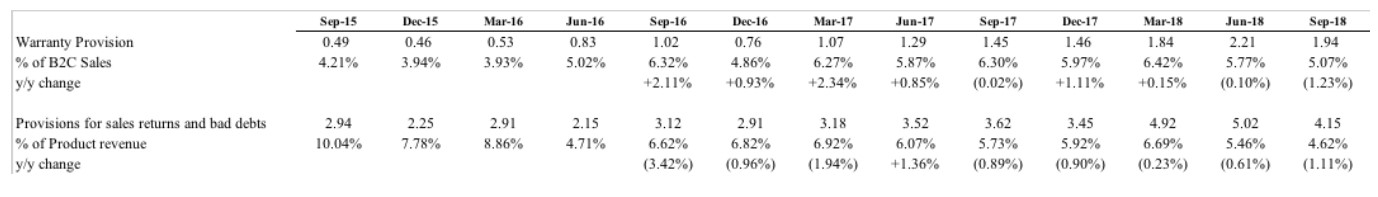
In Q3 2018, INGN lowered provisions in two categories, sales returns and bad debts and warranties. Doing so increased gross margin by 1.77%. We believe management did this to boost margins at a time when the business was experiencing pressure.
Beyond the accounting gimmicks, INGN is seemingly pulling every available lever to maintain growth, which would appear to be at odds with the narrative of a company that has a leading market position for a product that is only 11% penetrated.
INGN’s management team appears to be running out of runway in their quest to maintain the pace of sales growth. Management have recently characterized the impact that new sales initiatives are having on the financials as tradeoffs, or “investment that we think will drive growth”. We believe that moves such as the launch of two separate financing programs (one for small homecare providers and one for DTC), an increase in advertising spending, and white labeling are attempts to reach users that would otherwise be unable to afford the devices. A recent conversation we had with a former senior executive of The HELPcard, INGN’s financing partner, confirmed the suspicion. He explained that financing rates for consumers were as high as 20% with FICO scores in the low 600s and occasionally lower.
Since the IPO, INGN has been slowly shifting its sales from DTC to B2B. While this is logical as the company has scaled, we view the acceleration of growth in the B2B channel at the expense of the DTC channel over the last 24 months with concern because the margins are lower. B2B customers pay approximately $1,500 compared to retail, which pays closer to $2,200 depending on the model purchased.
Furthermore, INGN’s return on advertising has decreased over the last 24 months as the company has significantly ramped up its TV advertising and aggressively hired salespeople.
INGN management spun this as a “[r]eturn on those types of investment” and high sales and marketing spend being “An infrastructure that we need to make sure that we can maintain that market leadership position.” We believe this is further evidence that INGN are nearing saturation. Would a company that is selling a market-leading product in a category that is only 11% penetrated really be seeing such significant margin pressure at such an early stage in its growth cycle?
Likely Aware of the Upcoming Cliff, Management Have Started to Focus Investors on the “Big Opportunity in China”.39
With quotes like, “In China where it’s not reimbursed and then even if it’s a small percentage that can afford it, you still have a really big number. So that’s why we see this as a big opportunity on the retail side”, we are tempted to send Mr. Wilkinson a copy of “Doing Business in China for Dummies”, which was co-authored by Muddy Waters founder and CIO, Carson Block.
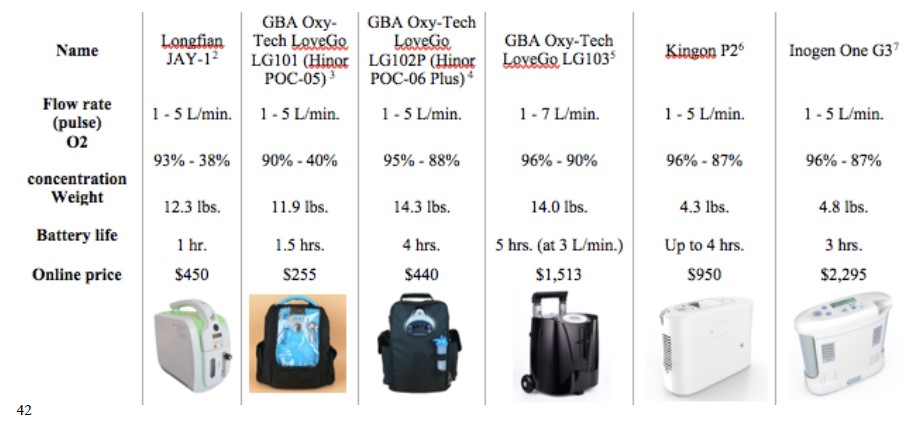
INGN’s price point will likely prove to be a stumbling block, given the retail price of its G4 is over $2,000. In 2017, China’s urban per capita household income was $5,200.40 2017 U.S. median household income was $60,336.41 Given the low barriers to entry, it isn’t surprising that Chinese players have cheaper, low-tech, heavier products available for $250 – $500. The Kingon P2 is available for half the price of a G3, despite its almost identical performance specifications. While we expect that the INGN products are better, if the Chinese products are good enough, we suspect INGN will have a very difficult time generating meaningful revenue in China.
Financial Projections and Valuation
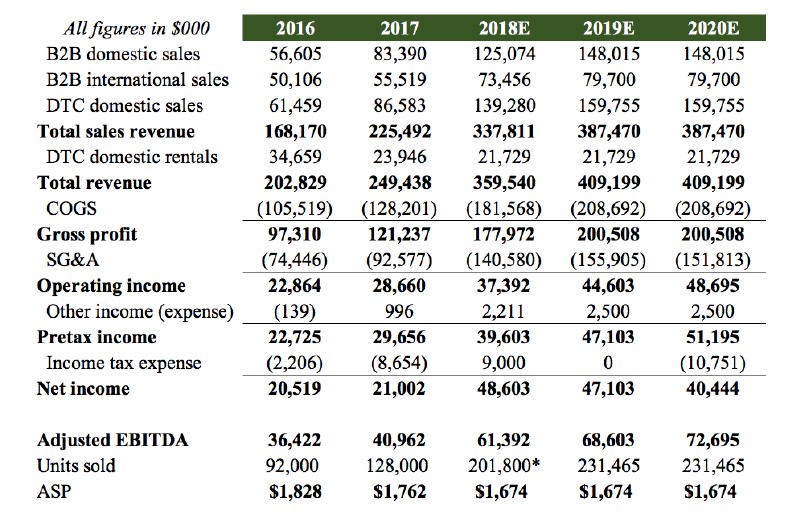
We modeled INGN’s financials for the near term to estimate when the company will hit peak sales. If we assume 2019 annual growth in units of 15%, INGN hits its run-rate unit sales peak this year. This results in 2019 sales growth of 18%. We did not model beyond 2020 because we think unit growth will be flat to declining; therefore, revenue will depend on ASPs, market share, B2B/DTC mix – none of which we forecast. In this scenario, 2019 is peak earnings ($47.1 million) because INGN has guided that its 2019 tax provision will be reduced by $12 million, effectively making it zero in our model.
While INGN now enjoys significant growth, when its market suddenly saturates, investors will likely afford it the same valuation as low- or no-growth medical device companies—a multiple of earnings rather than sales. We think 21x forward earnings, ex-cash, is generous.
Article by Muddy Waters

