
This is a follow-up to my unintendedly long magnum opus on this quite painful year. It’s been only a few weeks, but things have continued to stink. I somehow feel that when I write a cathartic tome that I’m proud of, the universe is supposed to notice and immediately turn things around. Nope. Unfortunately, that’s just not how this works. These last few weeks have been particularly hard as systematic value, still the cause of much of our year-to-date pain, has in fact had a decent bounce back (though now fading again as I write this). While my description of this year to date was, and is, accurate, I have always been clear that we’re very much not a pure value investor. In fact, in the long piece I wrote:
Q3 hedge fund letters, conference, scoops etc
Long-short systematic value investing (only a subset of what we do in individual stocks) is quite bad this year. In fact, it has been doing quite poorly since a little after the GFC ended. What's different this year versus prior years is that until 2018 other systematic long-short factors more than made up for it (after all, we only really care about the net).
That was me highlighting the good side of not being a one-factor bet (i.e., that we could do well for what’s been nearly a decade of poor value returns because the rest of our process was working more than enough to offset it). Of course, this also means the opposite can occur, particularly at short horizons. 1 In the last few days/weeks value has had a bit of a surge, again now fading, but the other factors (momentum and others) have done worse than value has done well. 2 This is, of course, particularly difficult in an already trying year. But it’s also endemic to the process we believe in and that’s worked for us long-term. We are not just one bet. Again, had we just been a single bet on value, the last near decade would’ve been one of fairly steady pain, and not the overall success we’ve seen.
As I discuss in my giant essay, we are admittedly hard to characterize with one liners (“the market is up/down so of course this happens!,” “value is up/down so of course this happens!,” “momentum is up/down so of course this happens!,” etc.). That’s much of the idea. But during very tough times, many want simple explanations, even though we’ve designed a process that can be frustrating to that end. 3 Frankly, I often want simple explanations too! But only for a moment, until my more level-headed colleagues explain to me again what I’m now writing about to you… (often sending me excerpts of my own work!)
Another thing I wrote in the original tome was:
As a blunt example, in general we believe in choosing individual stocks with good value, good momentum (both price and fundamental), low risk, high quality (e.g., profitability, margins), and positive views from those we think are “informed investors.” We like to under-weight or sell their opposites. When it doesn't work, or even hurts a lot for a while, we don't suddenly prefer expensive stocks with bad momentum, high risk, low quality, and negative views from informed investors. What I'm saying is, admittedly, our base case is to rely on the (in our humble opinion) overwhelming evidence we started with.
In line with the above, two different clients came up with the idea for this short blog (one in fact coming up with the title). In one episode of the greatest sitcom ever, 4 George Costanza, a perennial loser at all things (love, work, etc.) decided he must, in all things, “do the opposite” of what he’d normally do, as his normal way clearly wasn’t working out for him. From big decisions all the way to actions as small as what sandwich and hot beverage to order, he would do the opposite of what his every instinct told him to do. So, our clients’ great suggestion was for us to illustrate the results of our own personal “Costanza” portfolios. In other words, let’s examine what it would look like if we ignored my comment above when I said, for example, “we don't suddenly prefer expensive stocks with bad momentum, high risk, low quality, and negative views from informed investors.” For portfolios that we know have been long-term successful, we admittedly know the result before we look (the opposite will be bad!). Yet, I still think carrying out the exercise suggested by our clients leads to some interesting intuition and, at the least, a fun conceptual illustration in a not-so-fun year.
So, how do you construct “the opposite”? Well, it’s a bit more complicated than you might guess.
- Take our real-life returns gross of estimated transactions and financing costs and fees (i.e., starting with total gross-of-fee returns, add back estimated transactions and financing costs—don’t worry we’re going to subtract them again soon), and take out a cash hurdle. 5
- Negate that number and then subtract transactions and financing costs (we’re not going to subtract out fees from the “Costanza” portfolio as that would mean charging investors for an ex ante bad portfolio, gilding the lily making it look too bad — so the below is the “great deal” of getting this bad portfolio for free). That is the result if every long position was an equal magnitude short, and vice versa, and the transactions and financing costs of doing the opposite were the same as in the real-life portfolio (an imperfect, but we think very reasonable, assumption).
- Add that negated number back to cash to get the total return on “the opposite,” or “Costanza,” version.
- Compound the returns in 3) over time. Take the log of this compounded wealth (so as not to make recent returns artificially large or small versus older returns) and subtract out the log of similarly compounded cash (so as not to credit the Costanza portfolio with the simple cash return).
Sorry if (1) – (4) is a little pedantic or unclear. In English, all we’re basically doing is graphing the excess over cash for a manager implementing precisely the opposite of our real-life portfolios (and facing the same implementation costs but not charging fees).
We’ll look at three AQR portfolios that are in pain this year, and, for the longest horizon view, one sub-strategy of a broader fund, all through October 18, 2018. They all have some similarity as they share exposure to our market neutral equity strategy.
Let’s start with the hypothetical Costanza version of our portfolio (called “SSP” for Stock Selection Portfolio) that does only market-neutral stock selection around the world:
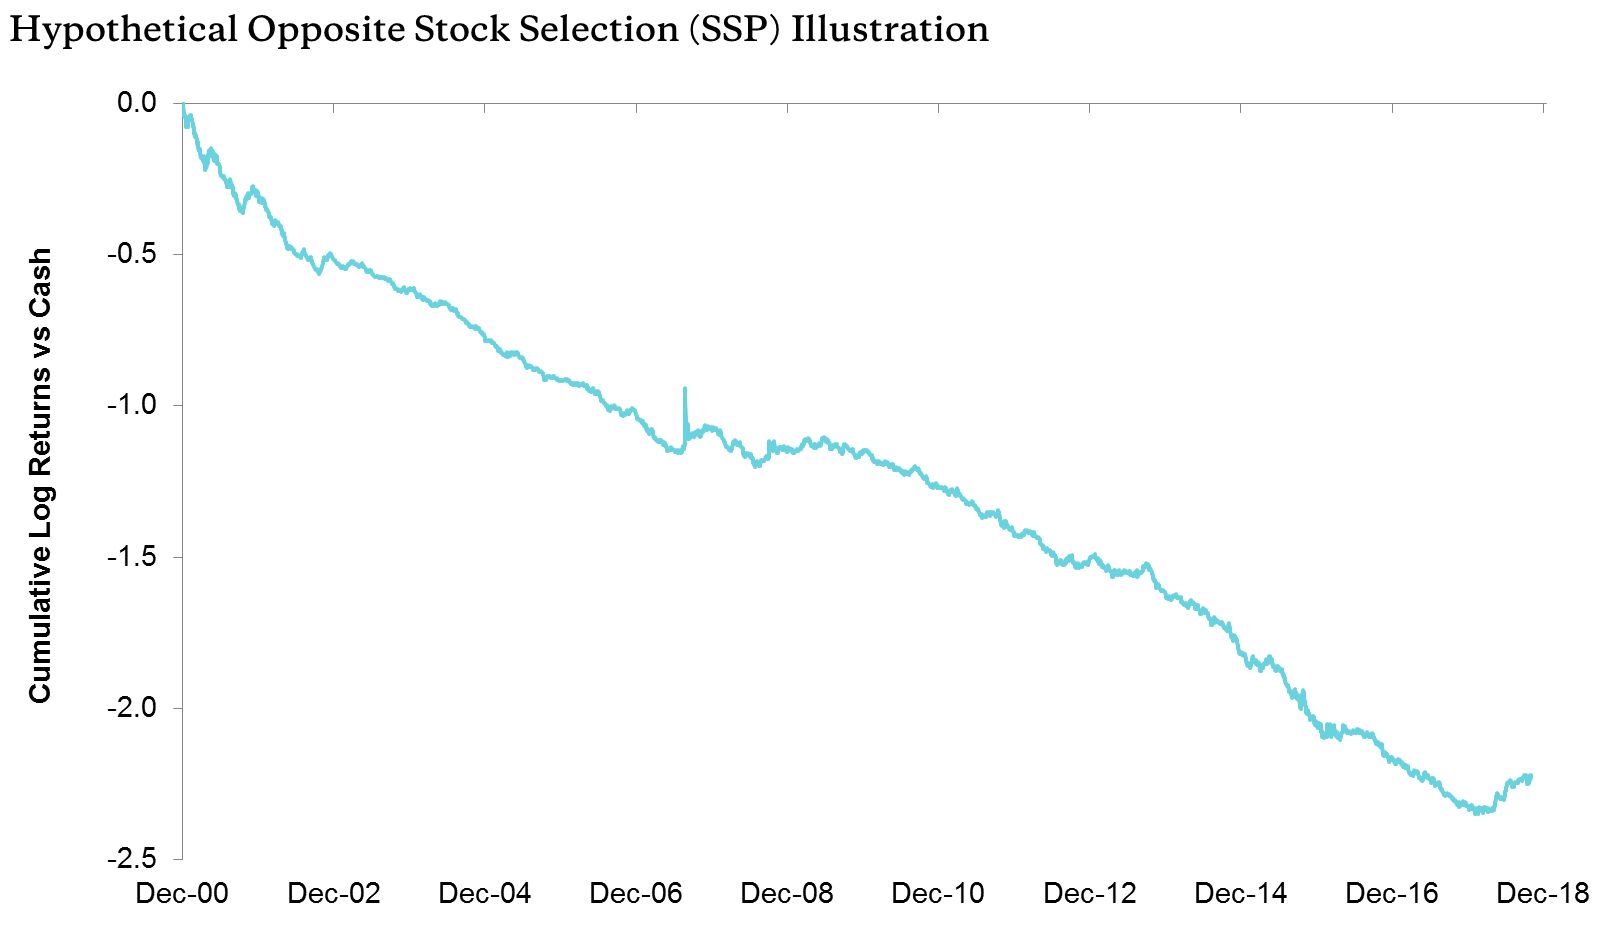
Source: AQR. For illustrative purposes only. Hypothetical data has inherent limitations, some of which are described in the disclosures. See detailed explanation in the body of this article, and additional disclosures at the end. This hypothetical performance does not reflect the deduction of any management fees, which as mentioned, would further reduce the actual return. It should not be assumed that the inversion of these charts is illustrative of actual portfolio performance.
Well, I told you we knew what we’d see going in, right? Even without paying investment management fees, I don’t think there would be many takers for this investment! It had a rather exciting melt-up in the “Quant Quake” of August 2007 as it was short quant big time (and short-lived, as the quake rapidly reversed). It’s had a few very small bounces along the way, with the most notable one outside of 2007 being this year. Still, it’s pretty darn ugly overall…
Now let’s look at our hypothetical “Costanza” styled DELTA and Style Premia Portfolios (these are over somewhat shorter periods than the SSP’s approximately eighteen years):
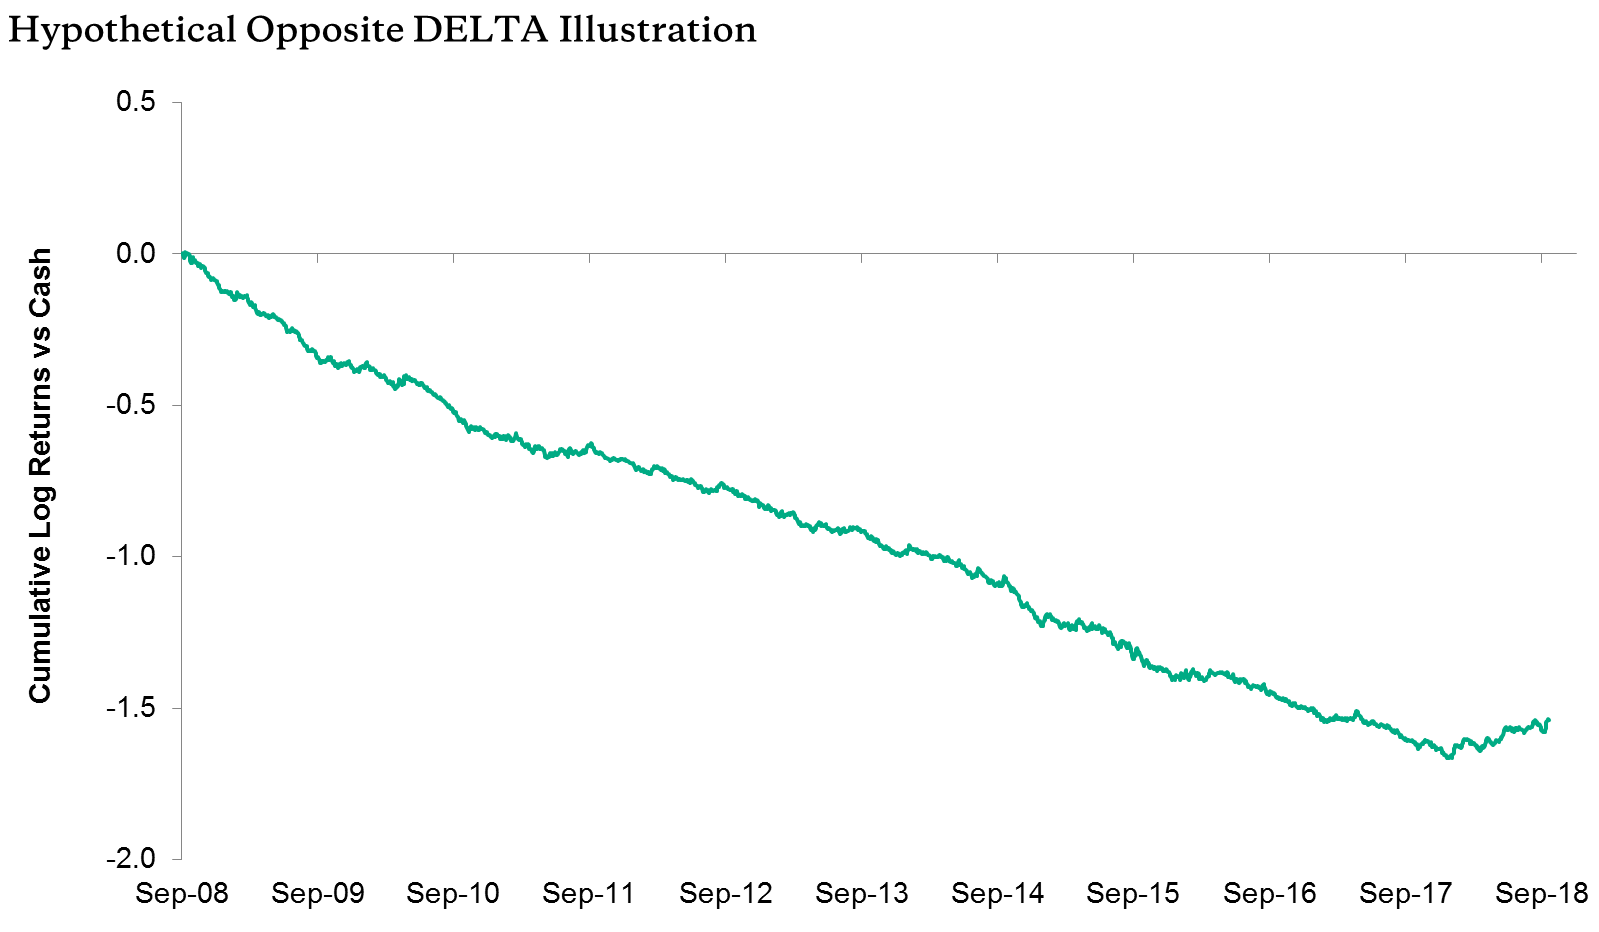
Source: AQR. For illustrative purposes only. Hypothetical data has inherent limitations, some of which are described in the disclosures. See detailed explanation in the body of this article, and additional disclosures at the end. This hypothetical performance does not reflect the deduction of any management fees, which as mentioned, would further reduce the actual return. It should not be assumed that the inversion of these charts is illustrative of actual portfolio performance.
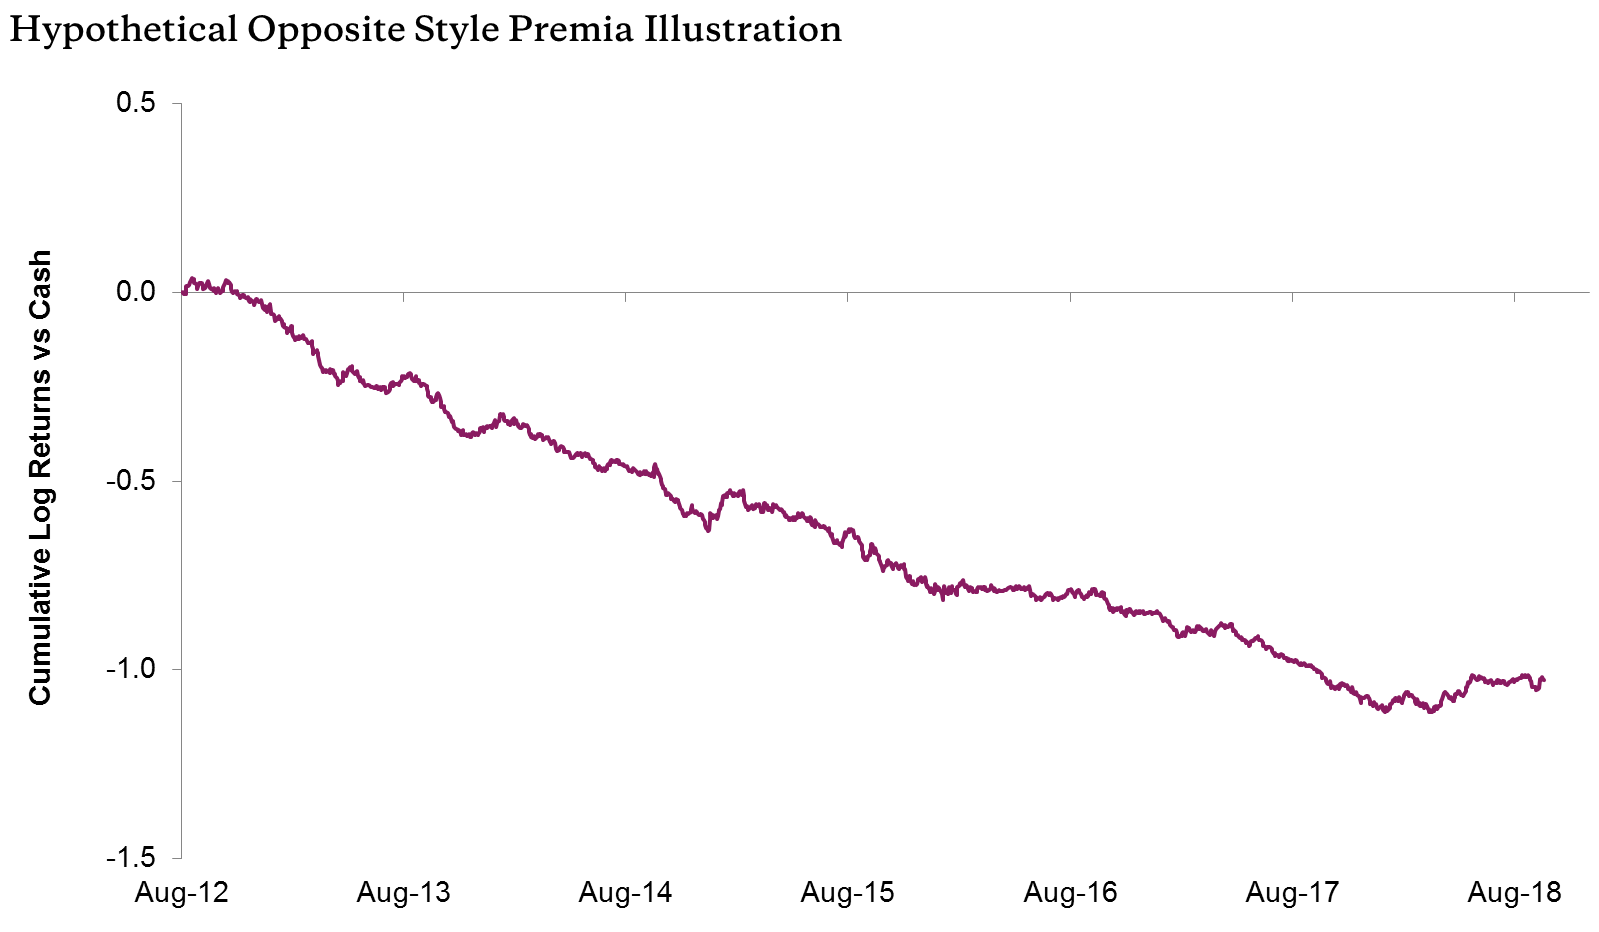
Source: AQR. For illustrative purposes only. Hypothetical data has inherent limitations, some of which are described in the disclosures. See detailed explanation in the body of this article, and additional disclosures at the end. This hypothetical performance does not reflect the deduction of any management fees, which as mentioned, would further reduce the actual return. It should not be assumed that the inversion of these charts is illustrative of actual portfolio performance.
You get it. This year is a pretty minor blip in a long-term disastrous strategy.
While not a stand-alone portfolio, we can go back a little further and do this same hypothetical analysis for the “contribution of market-neutral stock selection” to a broader portfolio since 1998 (we don’t have a stand-alone only market-neutral stock selection portfolio going that far back, and that’s the culprit this year that we really want to examine).
ARP stands for “Absolute Return Portfolio” and this “carve out” 6 is for the relevant market-neutral equity strategy:
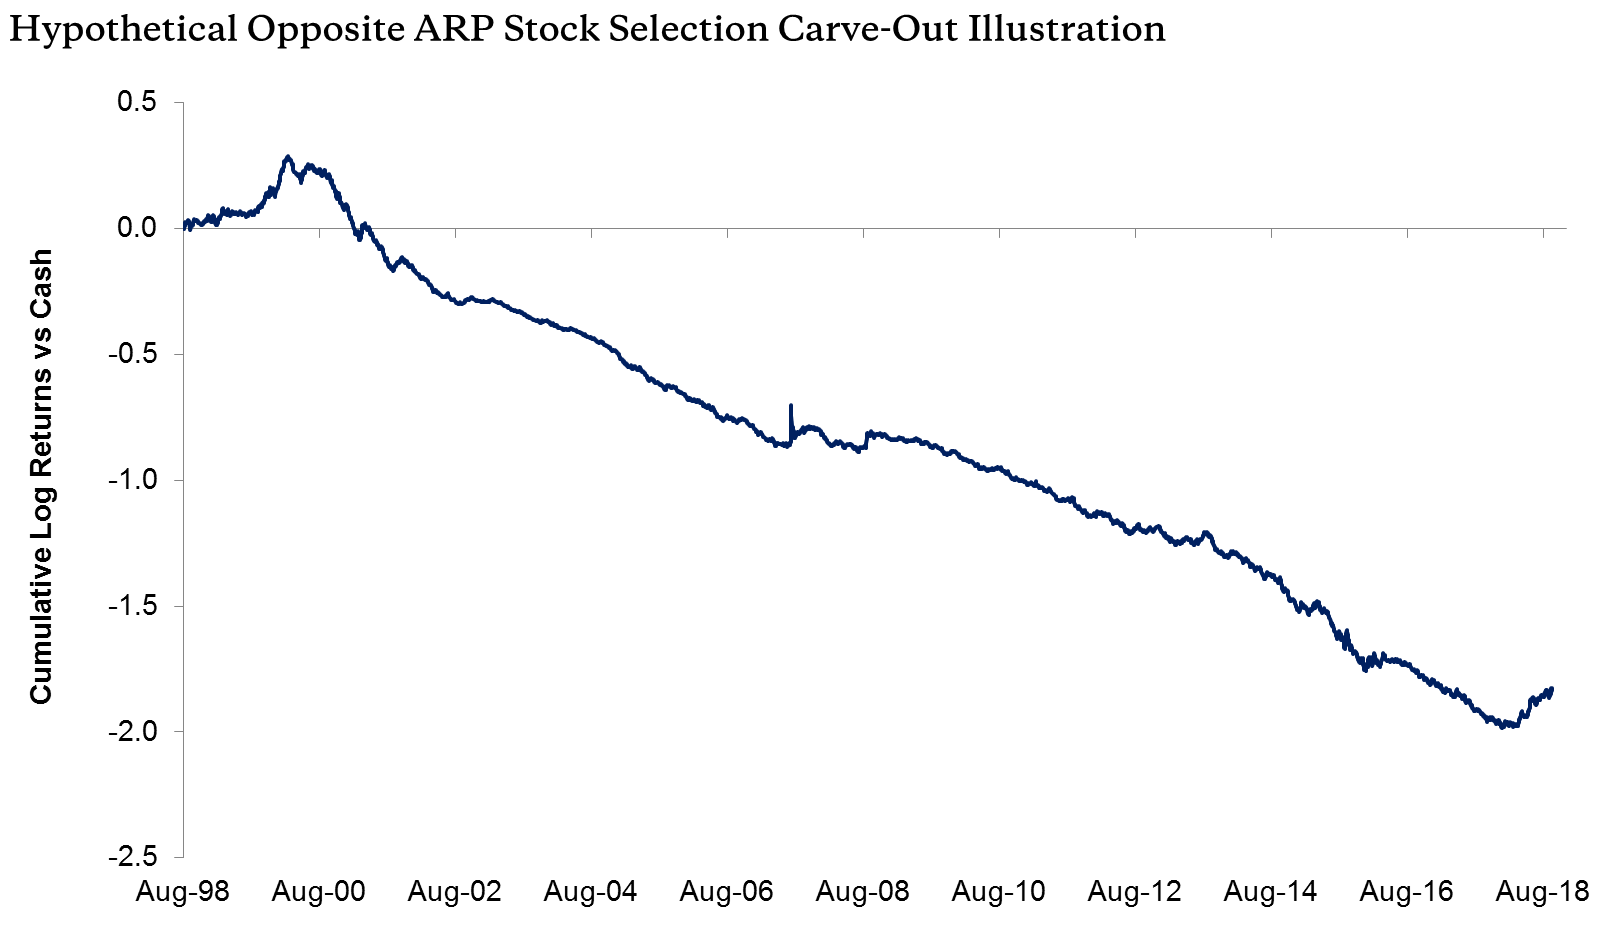
Source: AQR. For illustrative purposes only. Hypothetical data has inherent limitations, some of which are described in the disclosures. See detailed explanation in the body of this article, and additional disclosures at the end. This hypothetical performance does not reflect the deduction of any management fees, which as mentioned, would further reduce the actual return. It should not be assumed that the inversion of these charts is illustrative of actual portfolio performance.
Not surprisingly, this is very similar to the SSP shown above. But the longer period shows that George C. did enjoy an additional heyday back in the tech bubble of 1999-2000. That would’ve been a much more fun starting contribution than what we really got when we lost a lot of money out of the box during that crazy period! 7 And while smaller looking, due to scaling, you still see that exciting few days for this opposite portfolio in August of 2007. And, of course, the recent 2018 period of Costanza-style moderate joy.
OK, admittedly again, the above was all kind of obvious given the long-term success of these live strategies. But we still find it edifying to consider what if I had turned out to be Evil Spock and the rest of AQR my loyal henchmen. It would not have been pretty.
Of course, the dream is to have our portfolio most of the time but with the ability to perfectly time a move to the “Costanza” portfolio for the few and far between years like this. We’ve written before about how we’re mostly (not entirely) skeptical about market-, and its close cousin factor-, timing. We believe the mostly untimed portfolio (what we do) can still be a great long-term addition to investor portfolios, and we’ll continue our long-running efforts to come up with active timing strategies we believe in more than “a little.” But again, like for timing the market, we are somewhat pessimistic about great breakthroughs. Taking a process that can yield significant risk-adjusted diversifying returns and adding really great timing to avoid the bad times, which are part of those returns, would obviously improve things further, perhaps substantially. It’s a nice dream, but still a dream, and a dream we think hurts more investors than it helps (whose version of timing is too often getting out at the bottom and in at the top!).
To be fair, you don’t have to choose between AQR’s portfolios and George Costanza’s versions. You’re allowed to do neither. 8 Obviously, repeating the above, we still believe in choosing individual stocks with good value, good momentum (both price and fundamental), low risk, high quality (e.g., profitability, margins), and positive views from those we think are “informed investors” and underweighting or shorting their opposites. We think the historical evidence is overwhelming (and barely nicked by adding in this excruciating year). We think we’ve explored every reasonable hypothesis for why now might be different. 9 So, while it’s certainly not a proof you should stick with our versions, sadly we don’t get to do proofs in our field, we do think the “Costanza Portfolio” is a neat way to see the folly of fighting these, in our belief, very real long-term money makers. The long-term evidence (across geographies, asset classes, and time) and argument (theory and intuition) is intact. No specific hypothesis other than a very bad “draw” this year, which we expect on occasion and have seen in the past, for our factors has been found to hold any water (my giant essay explored many of these hypotheses).
So, while we know you didn’t doubt this, we, for one, do not intend to do “the opposite” a la George Costanza.
Article by Cliff Asness, AQR
