HowMuch
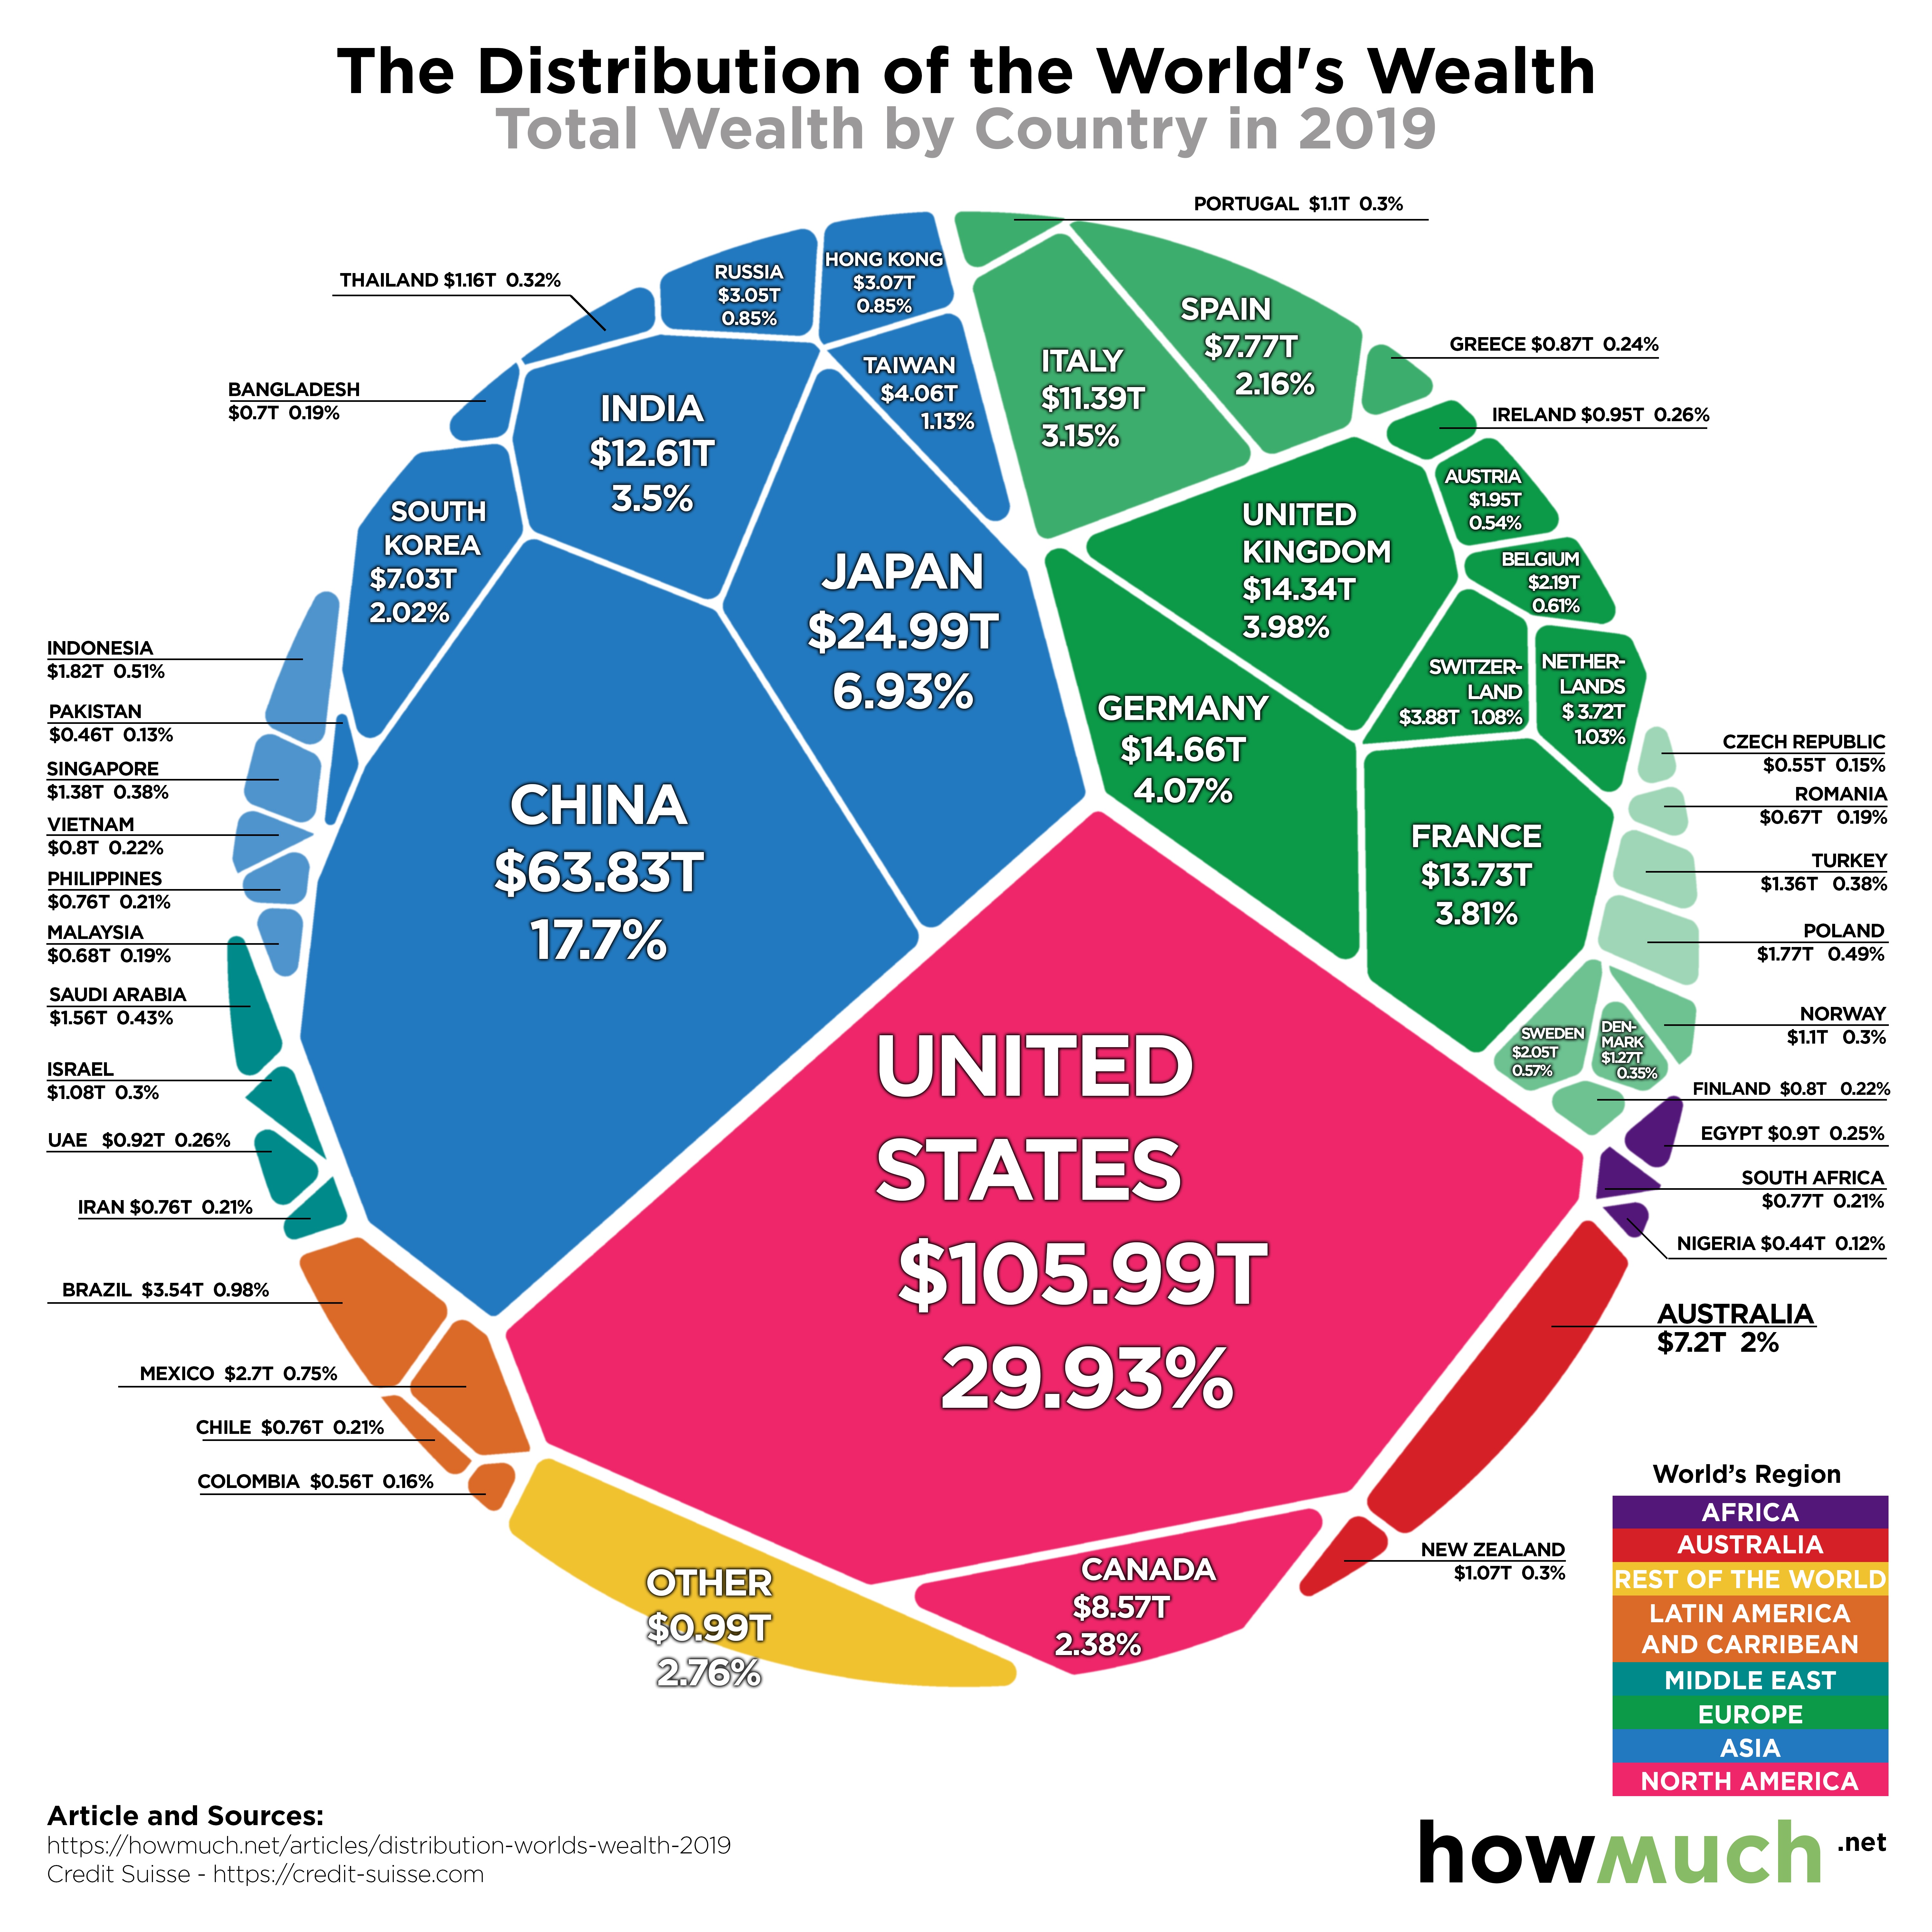
All the World’s Wealth in One Visual

Charted: The U.S. Metro Areas with the Worst Wage Inequality
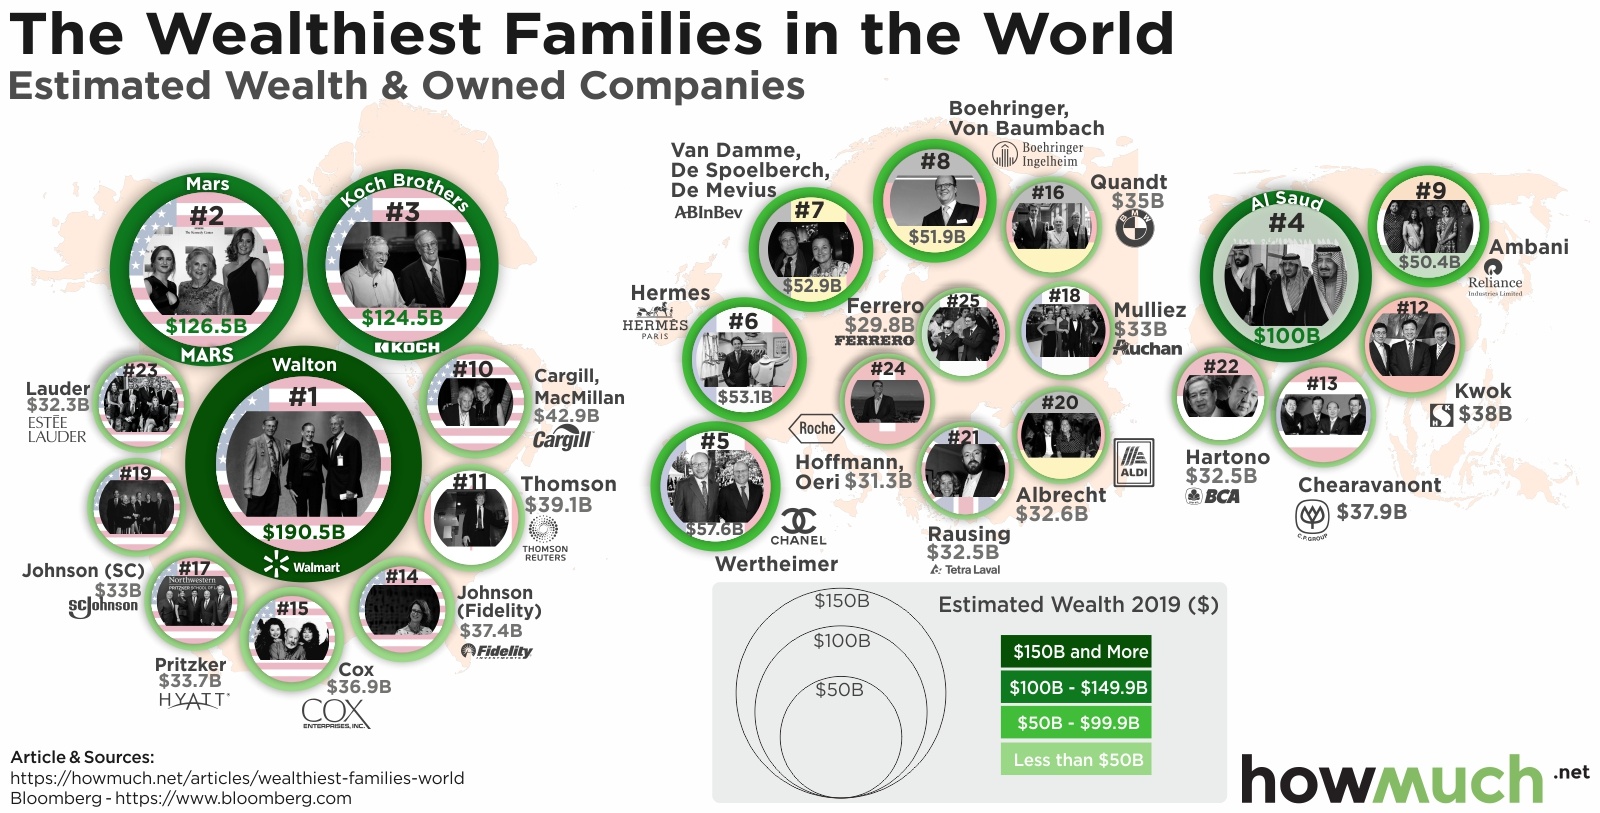
Mapping Filthy Rich Families Around the World
Visualizing 90 Years of U.S. Economic Growth, in One Chart
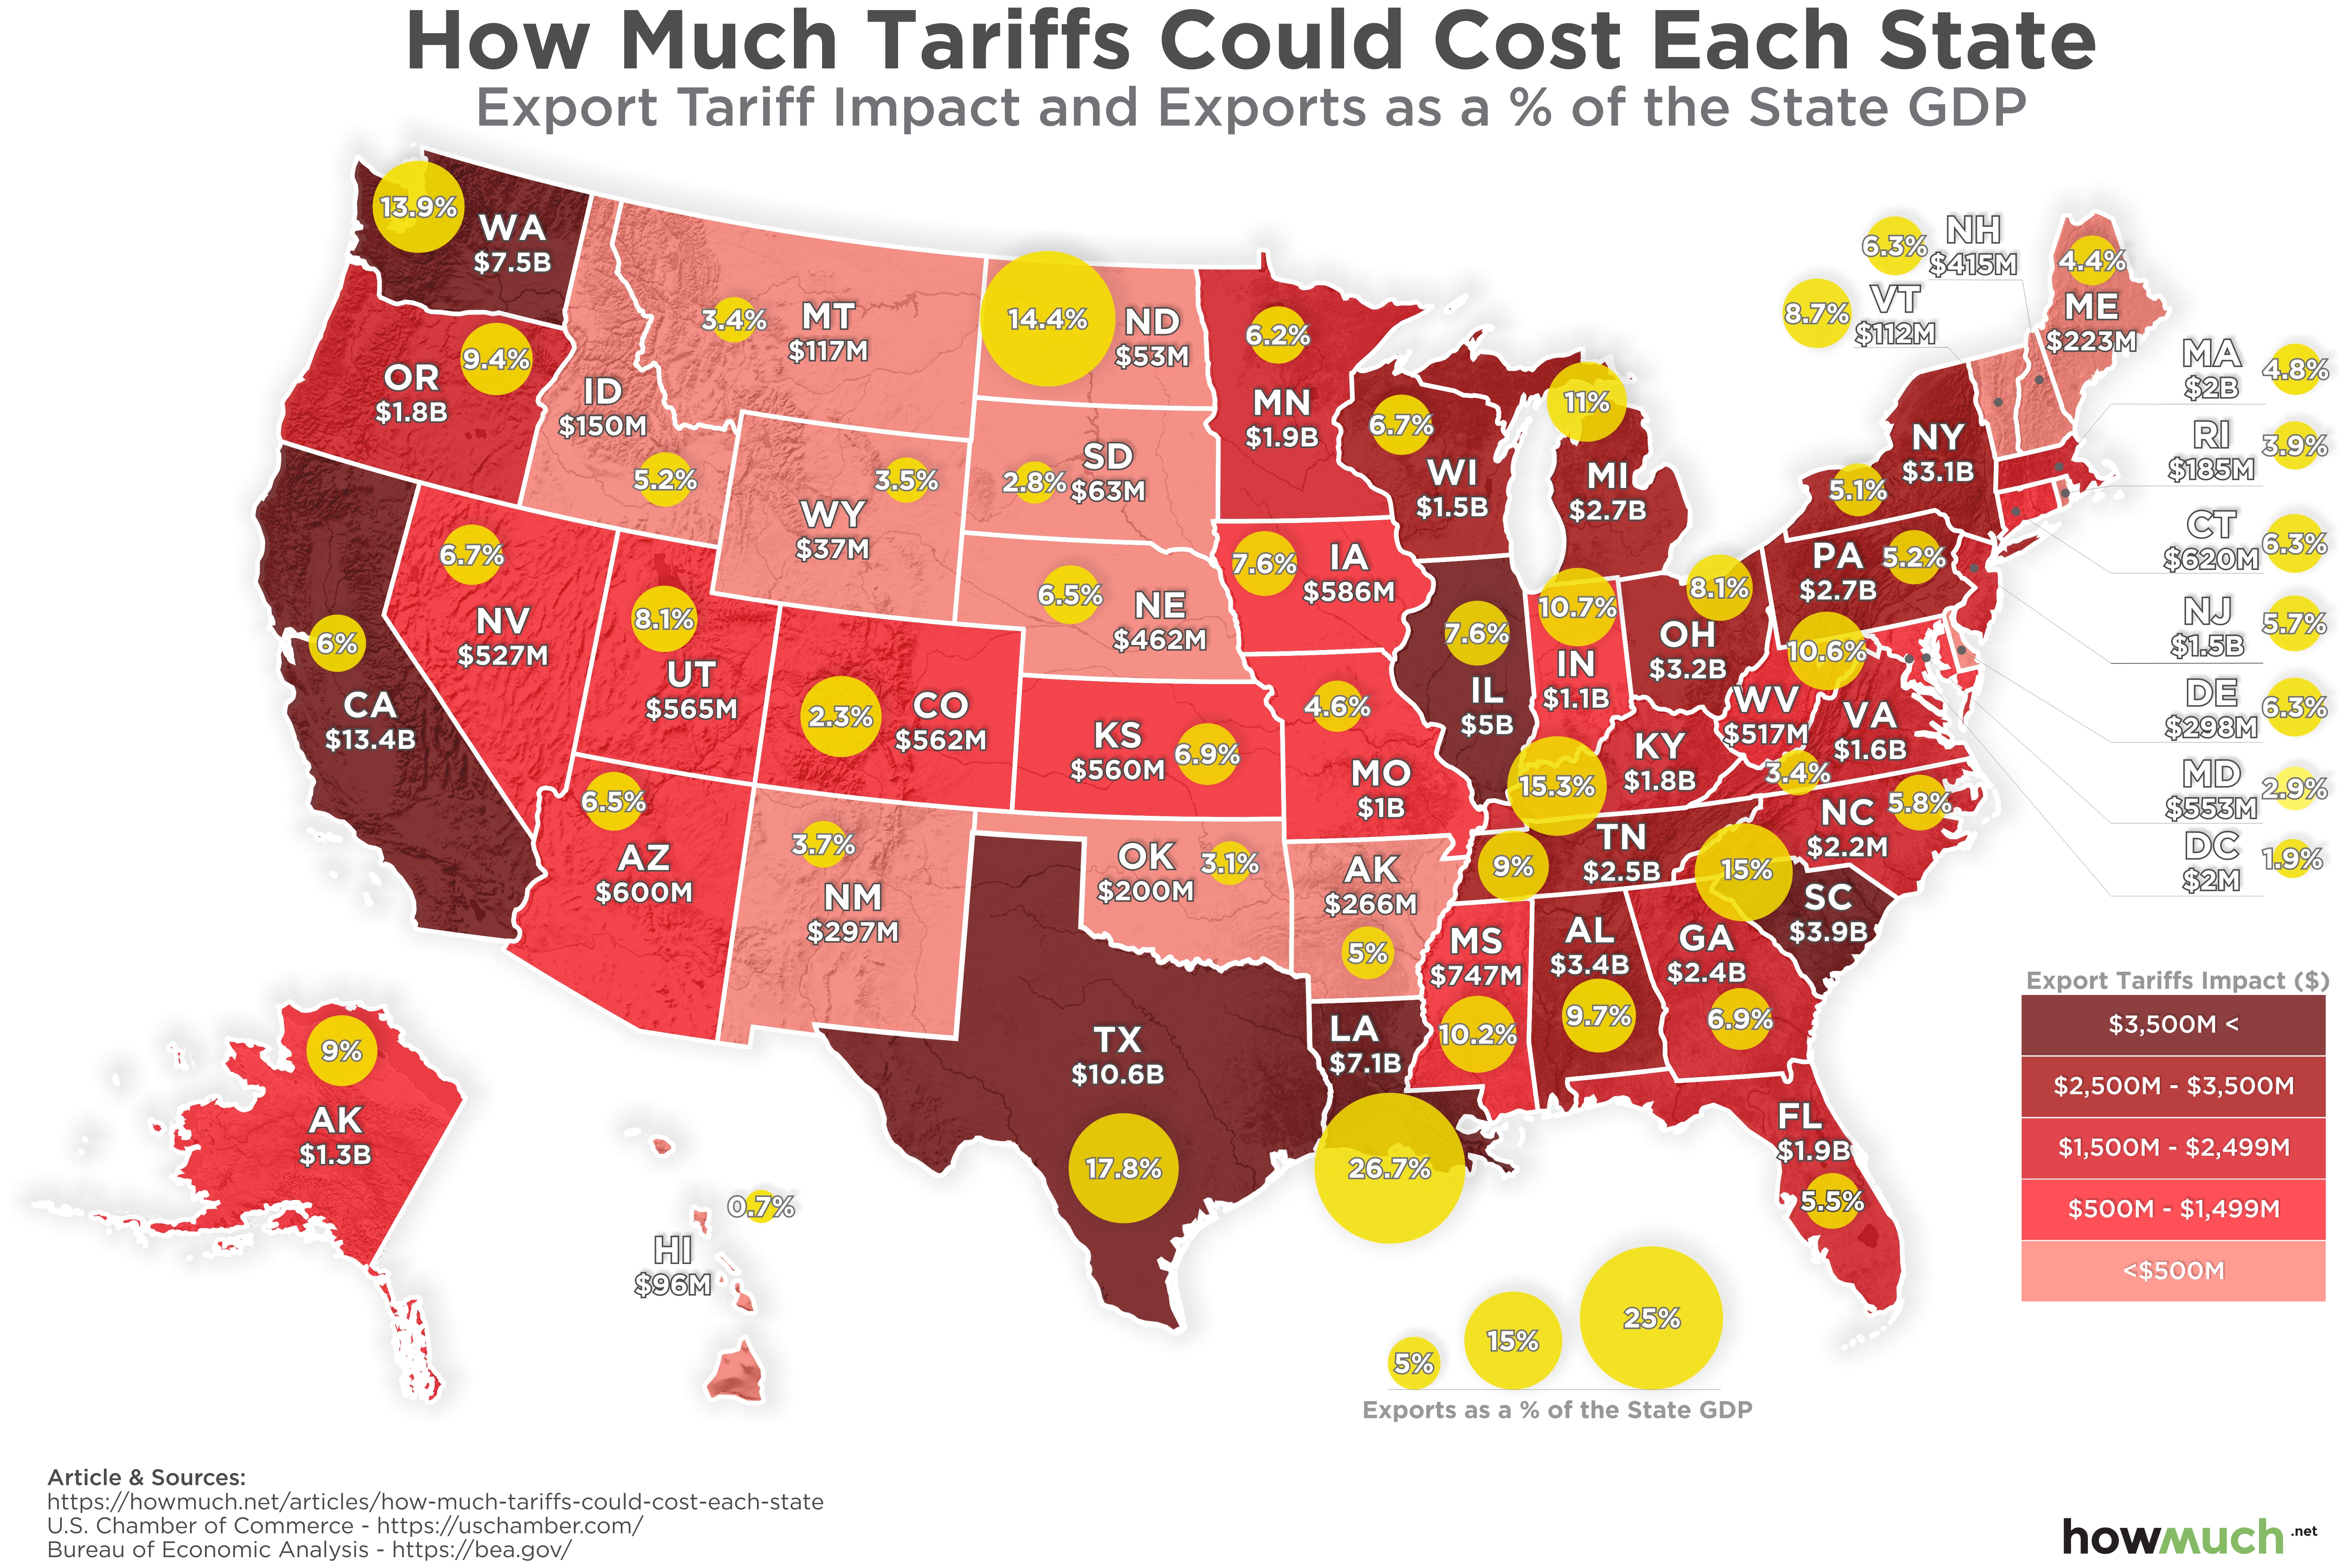
In One Map: Where the U.S. Economy is Built
Visualizing Top 20 Most Valuable Companies of All Time
A Snapshot of Income Inequality Around the U.S.
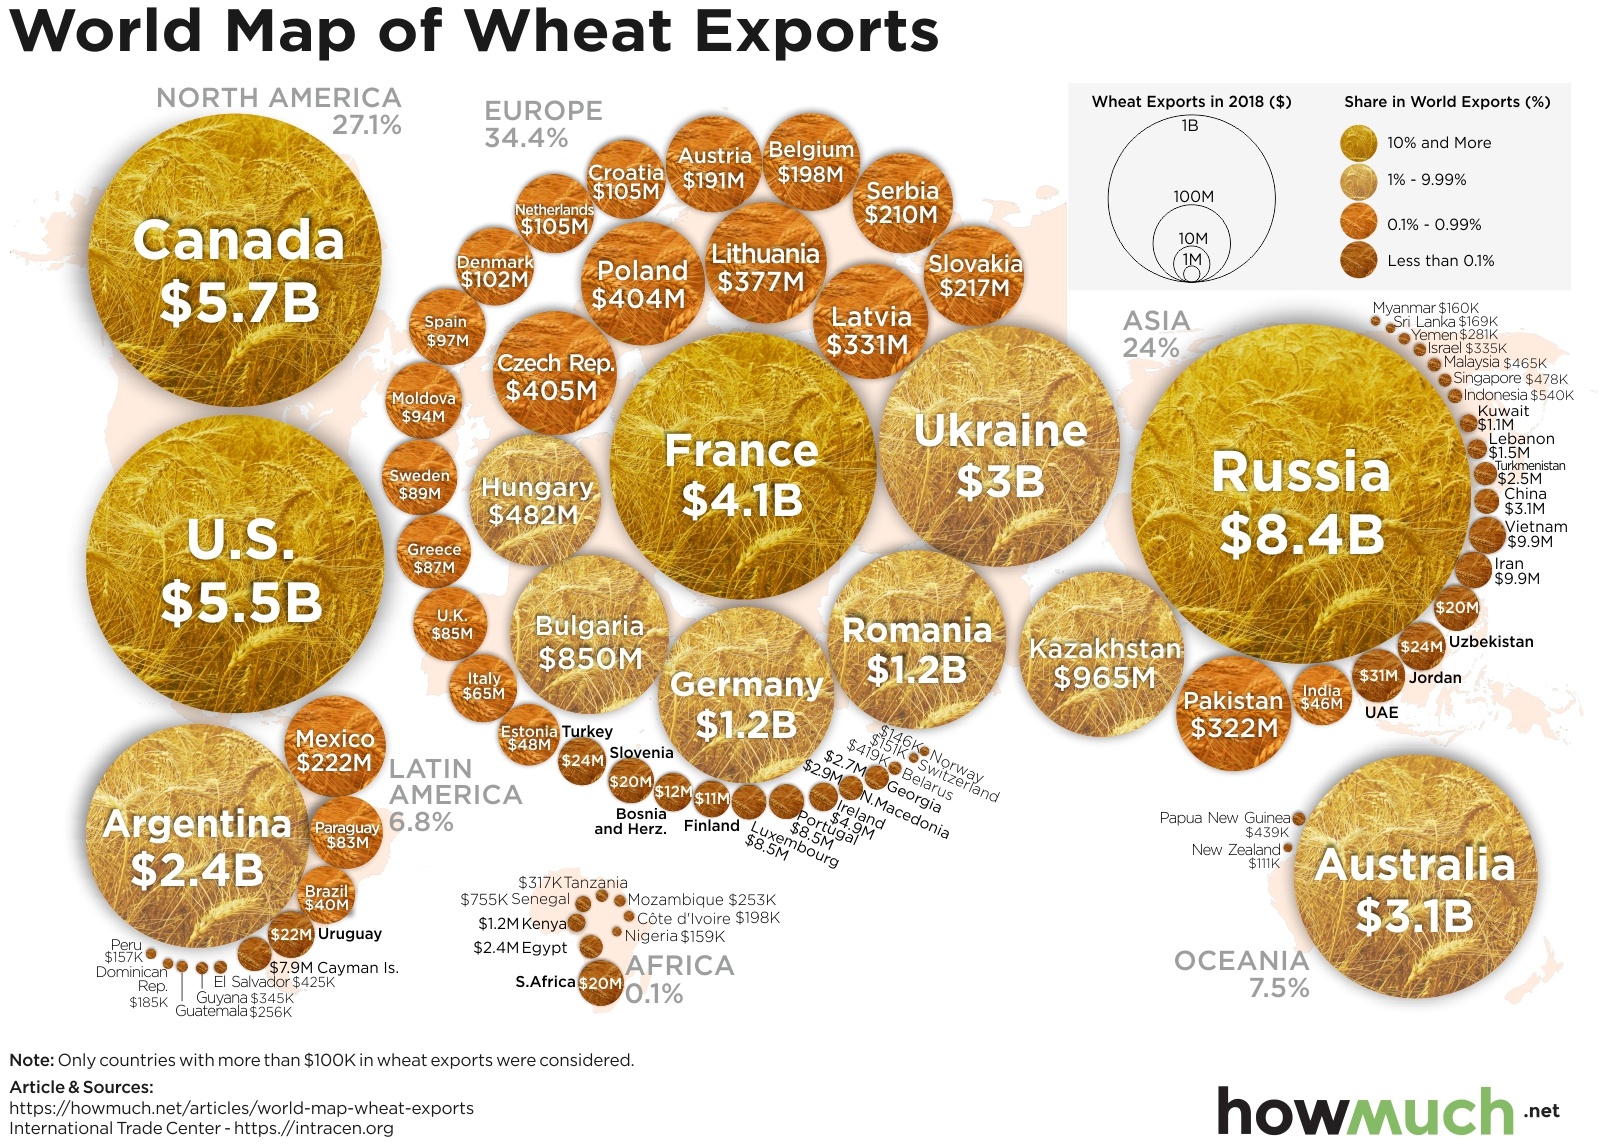
A Snapshot of Worldwide Wheat Exports
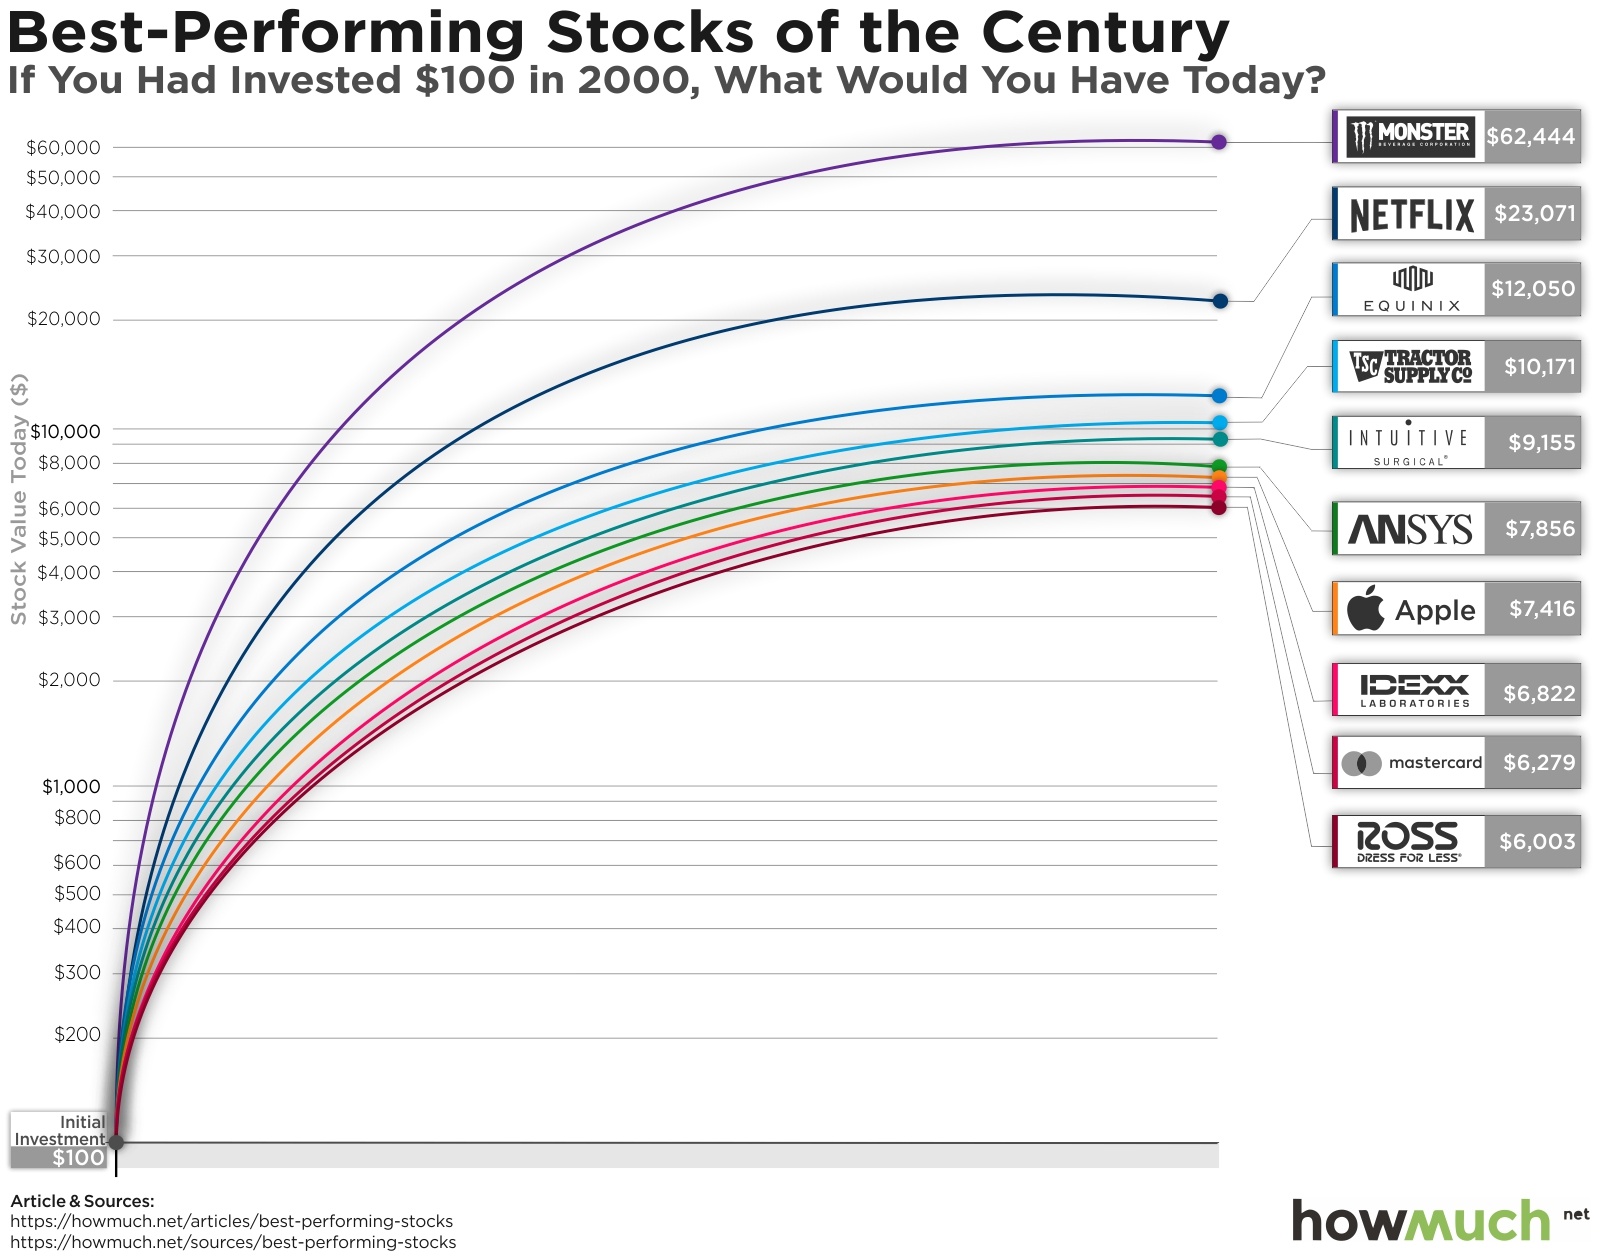
Top 10 Hottest Stocks Since 2000: What if You had Invested $100? (Caveat Emptor)
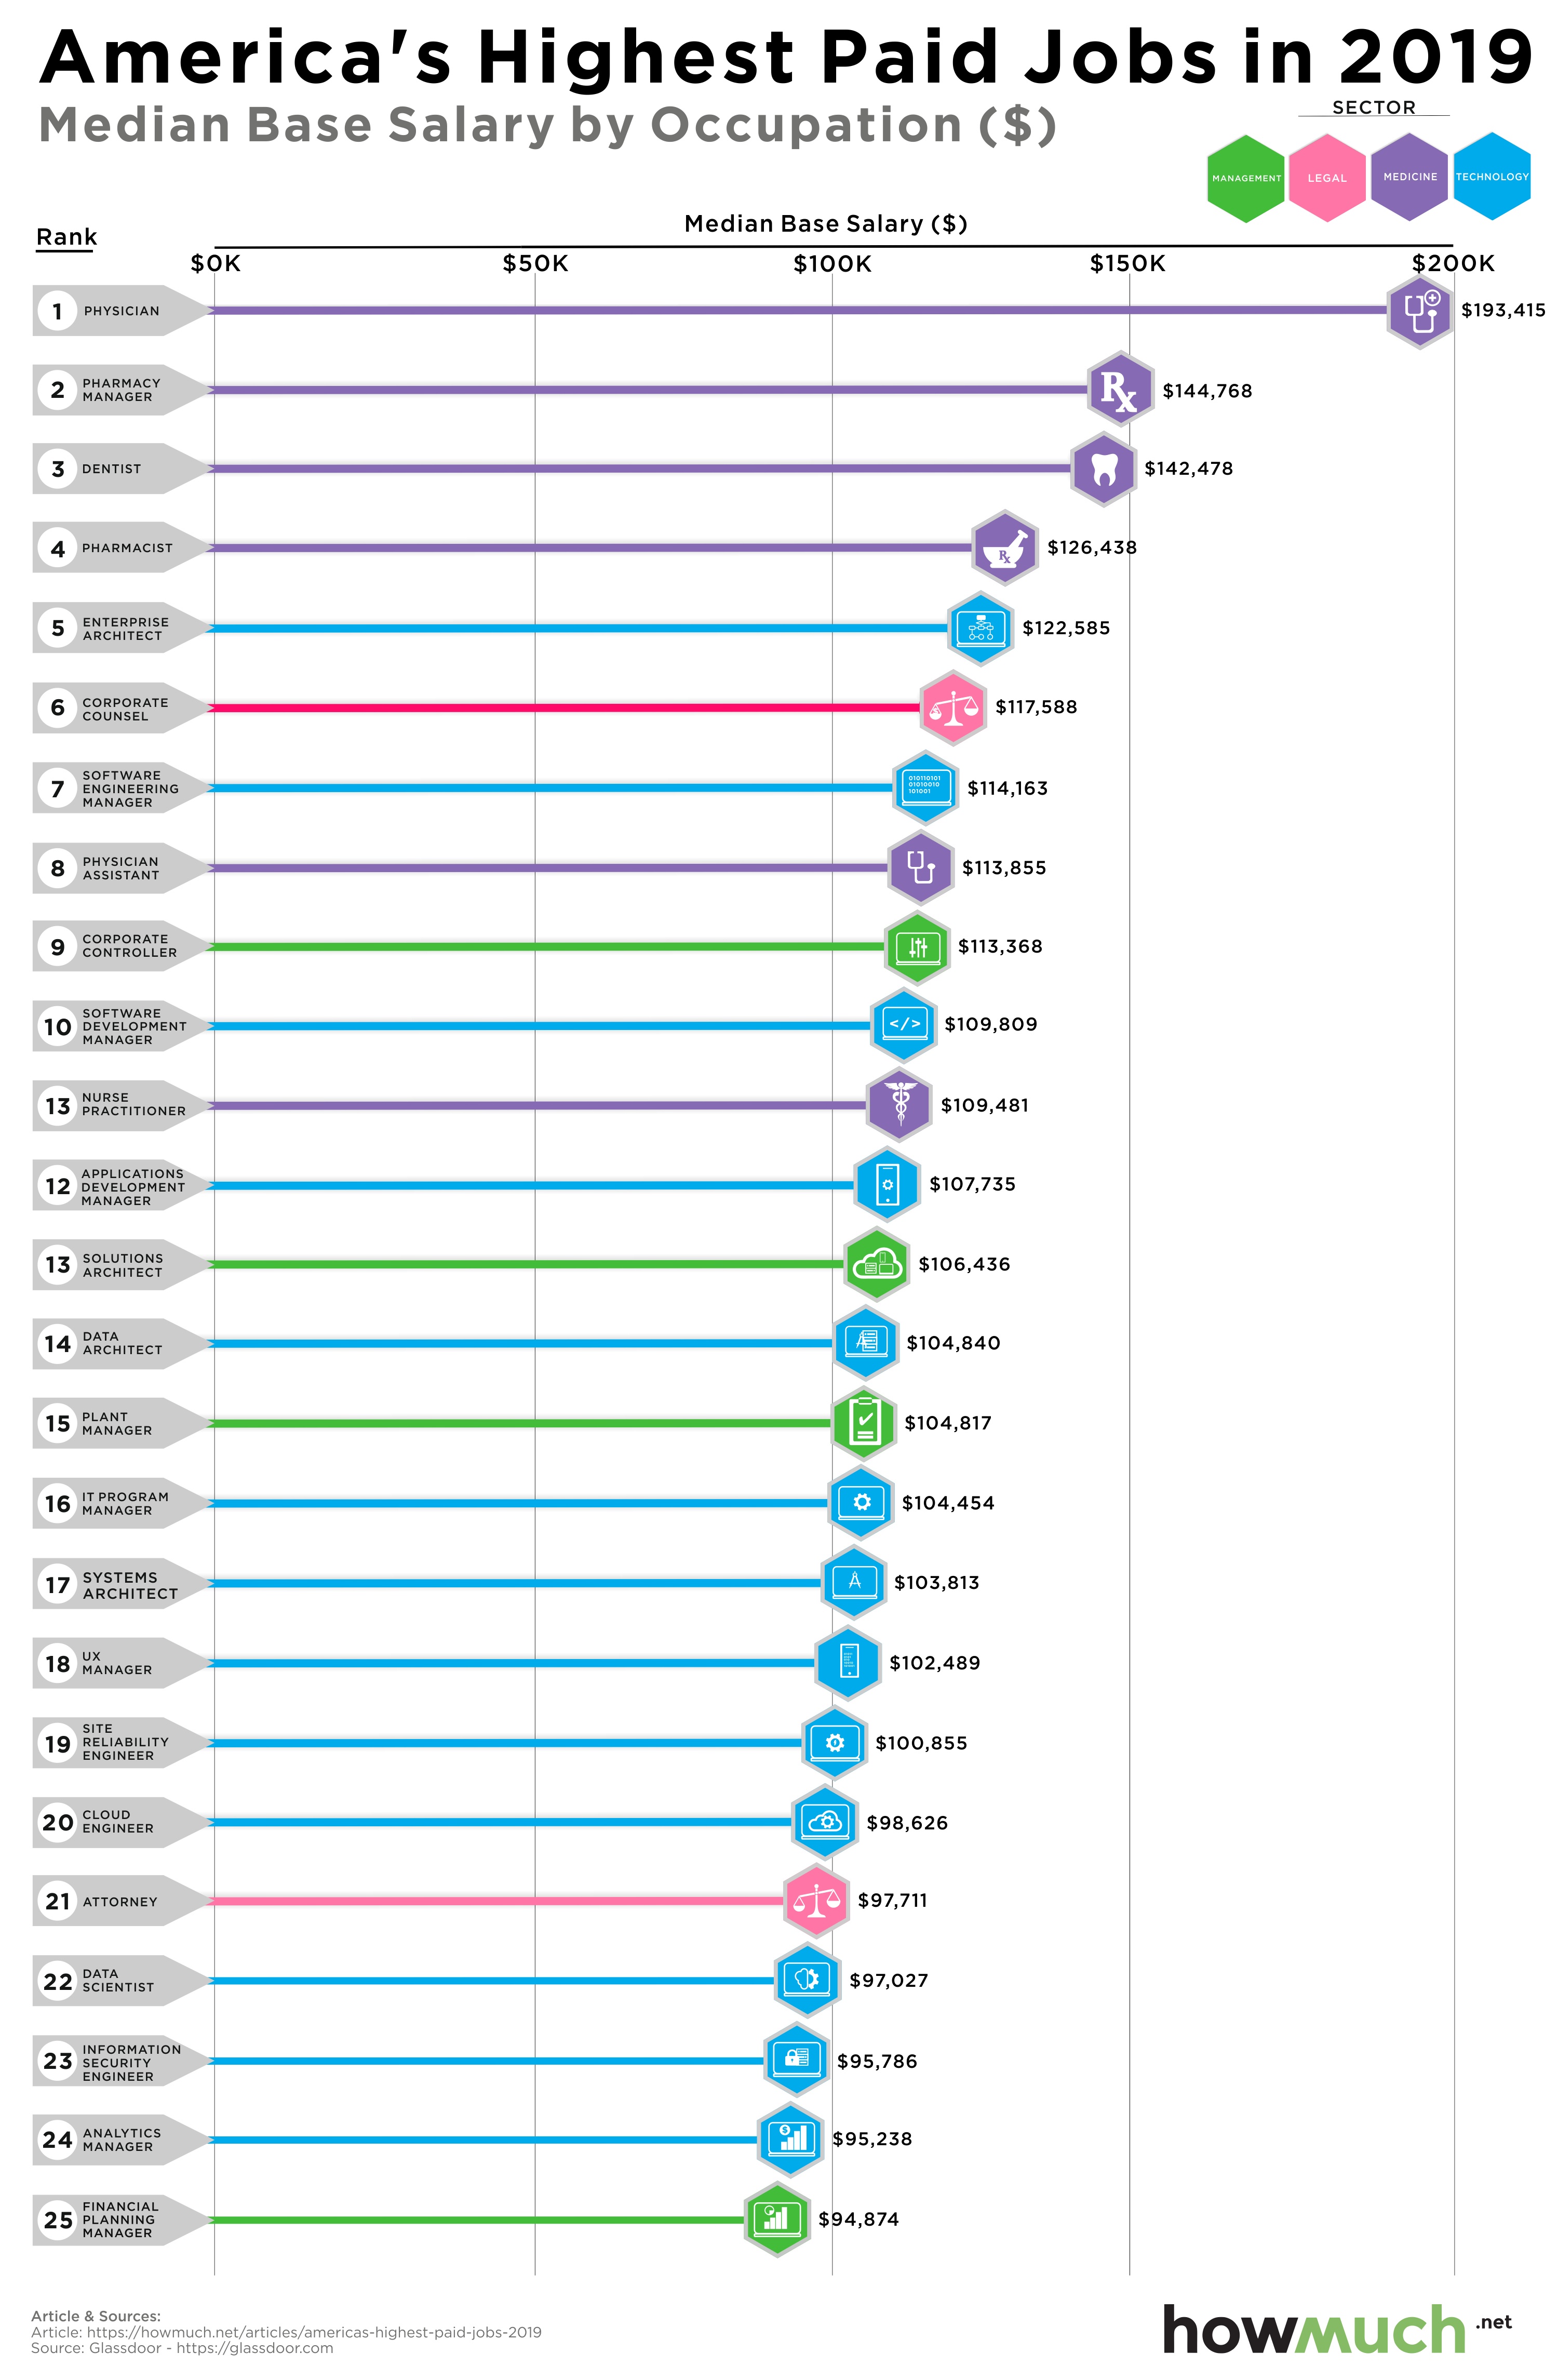
Charted: These U.S. Jobs Have The Biggest Paychecks In 2019
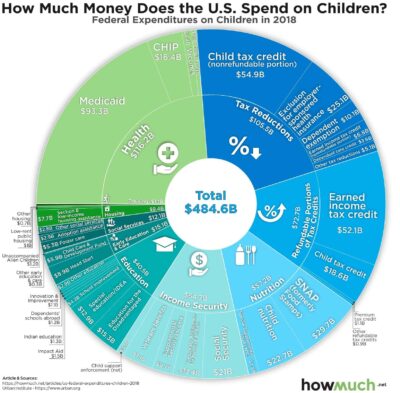
Budgeting For The Children: Where Does The Money Go?
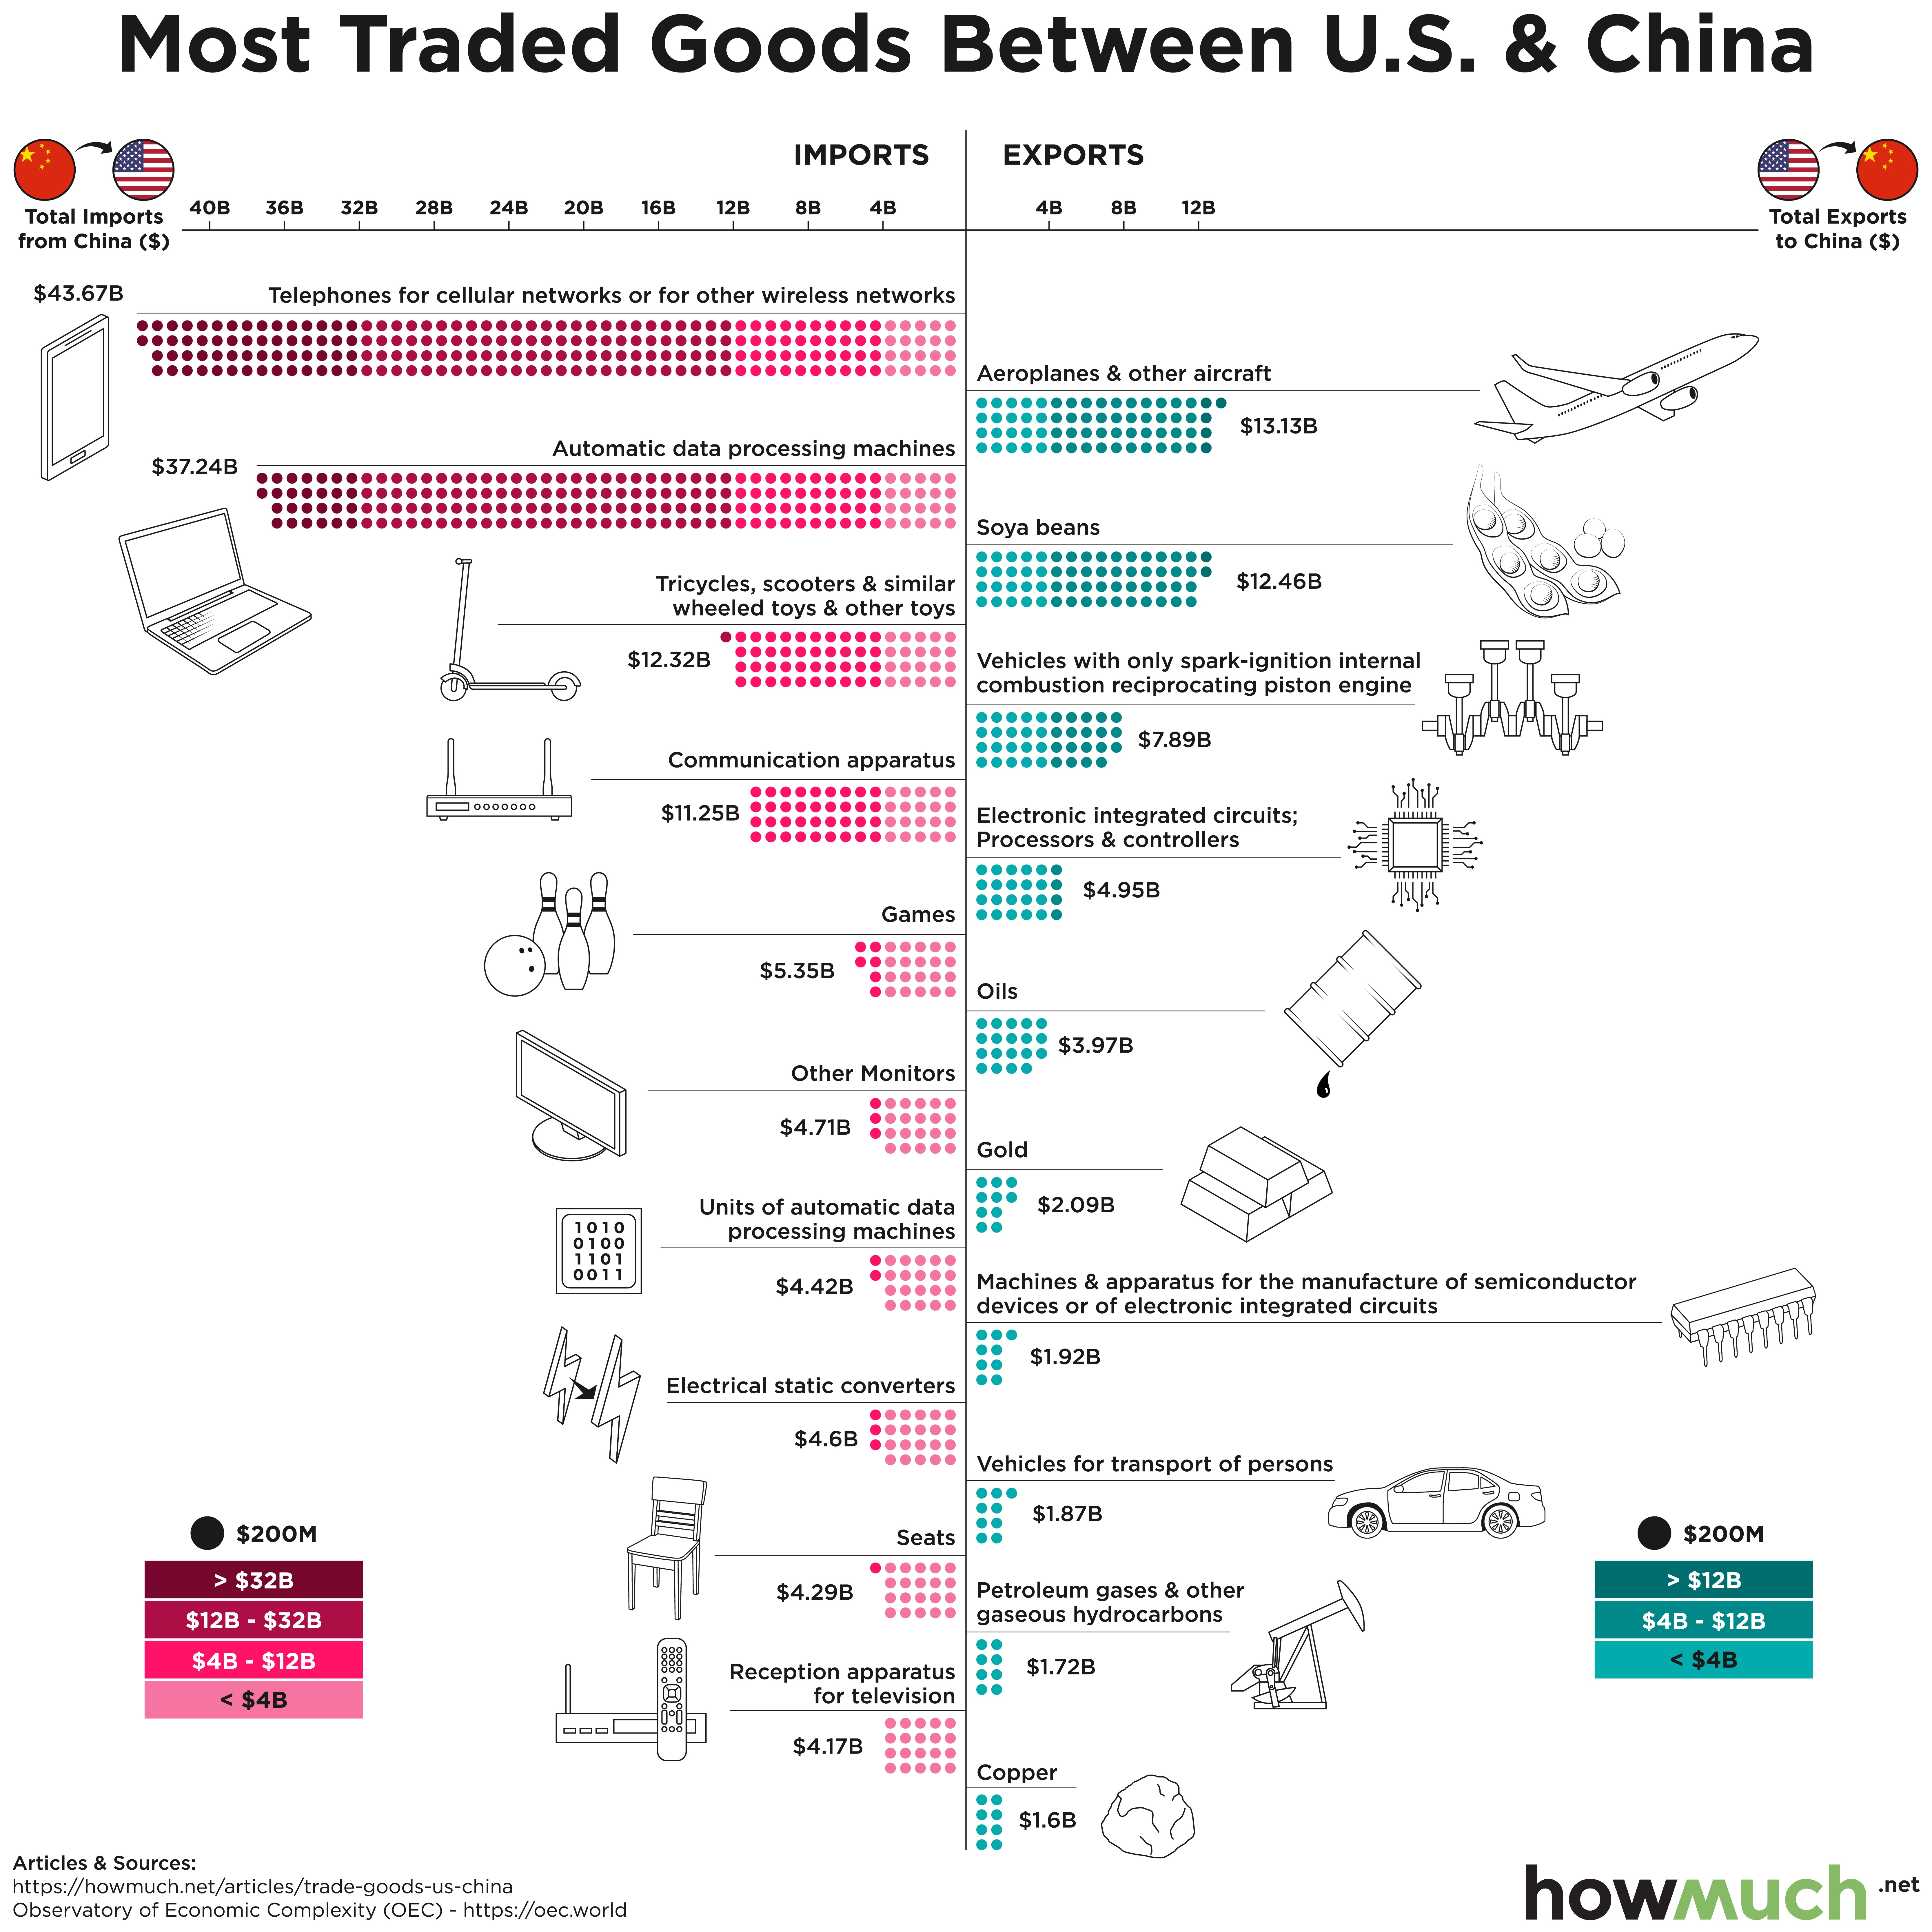
Which Goods Are Most Traded Between U.S. & China?
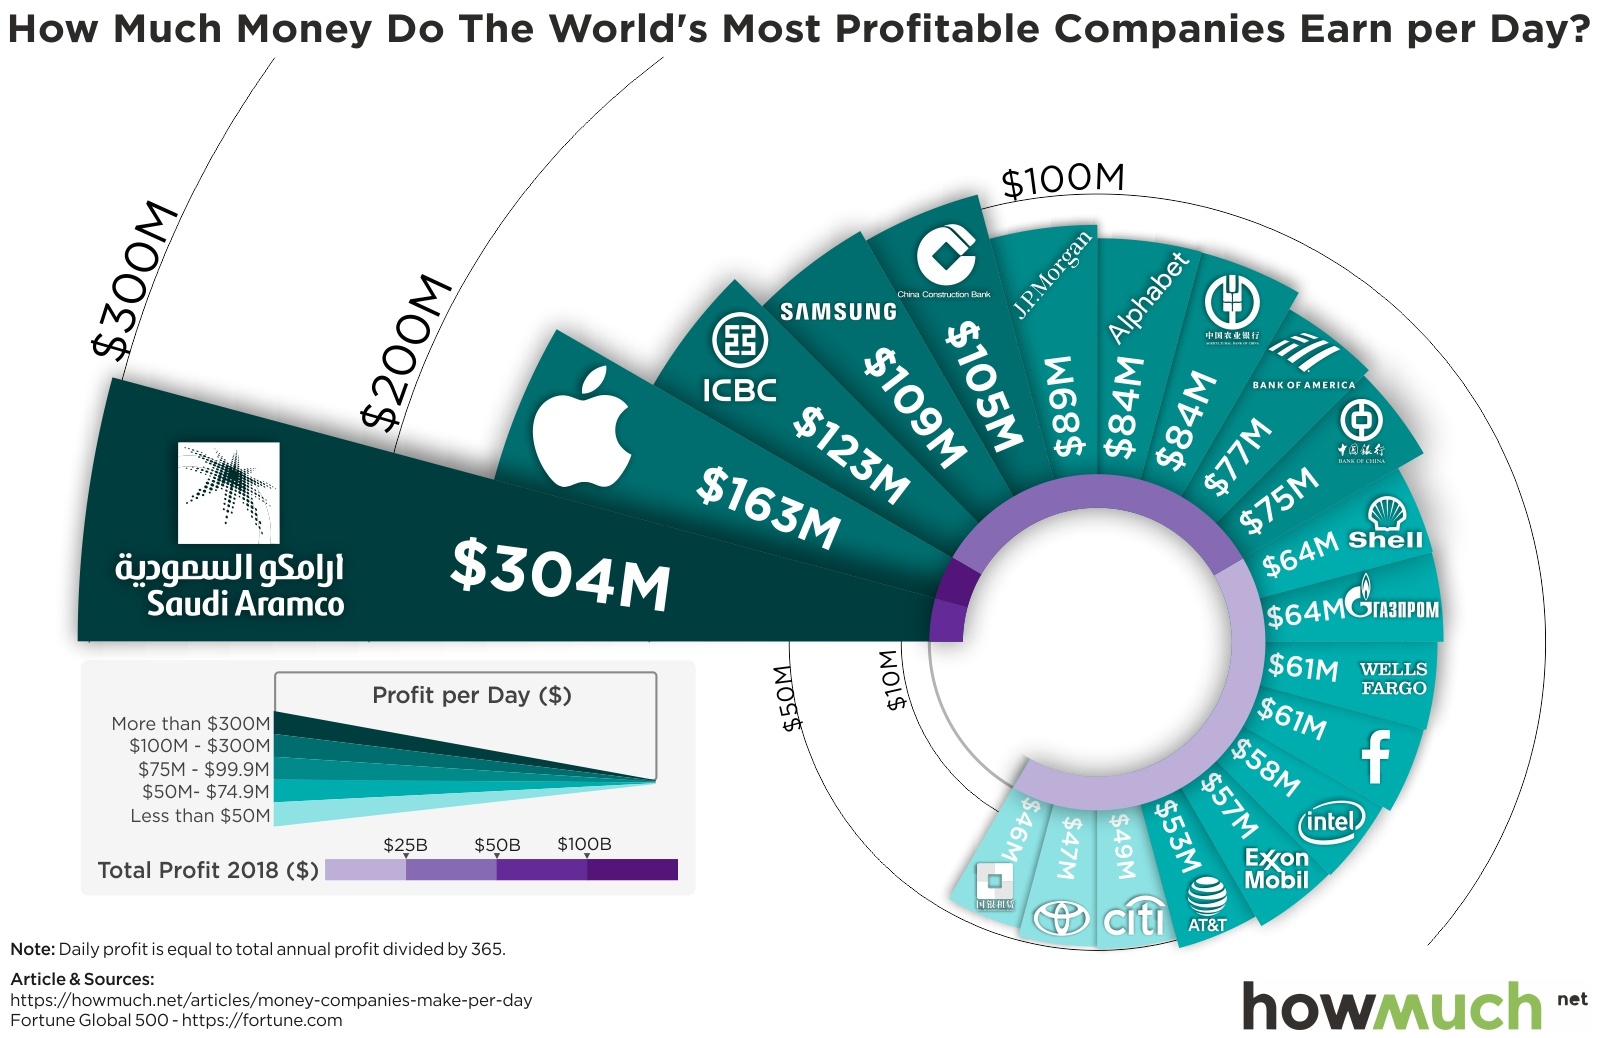
Charted: These Giant Companies Make Millions Every Day
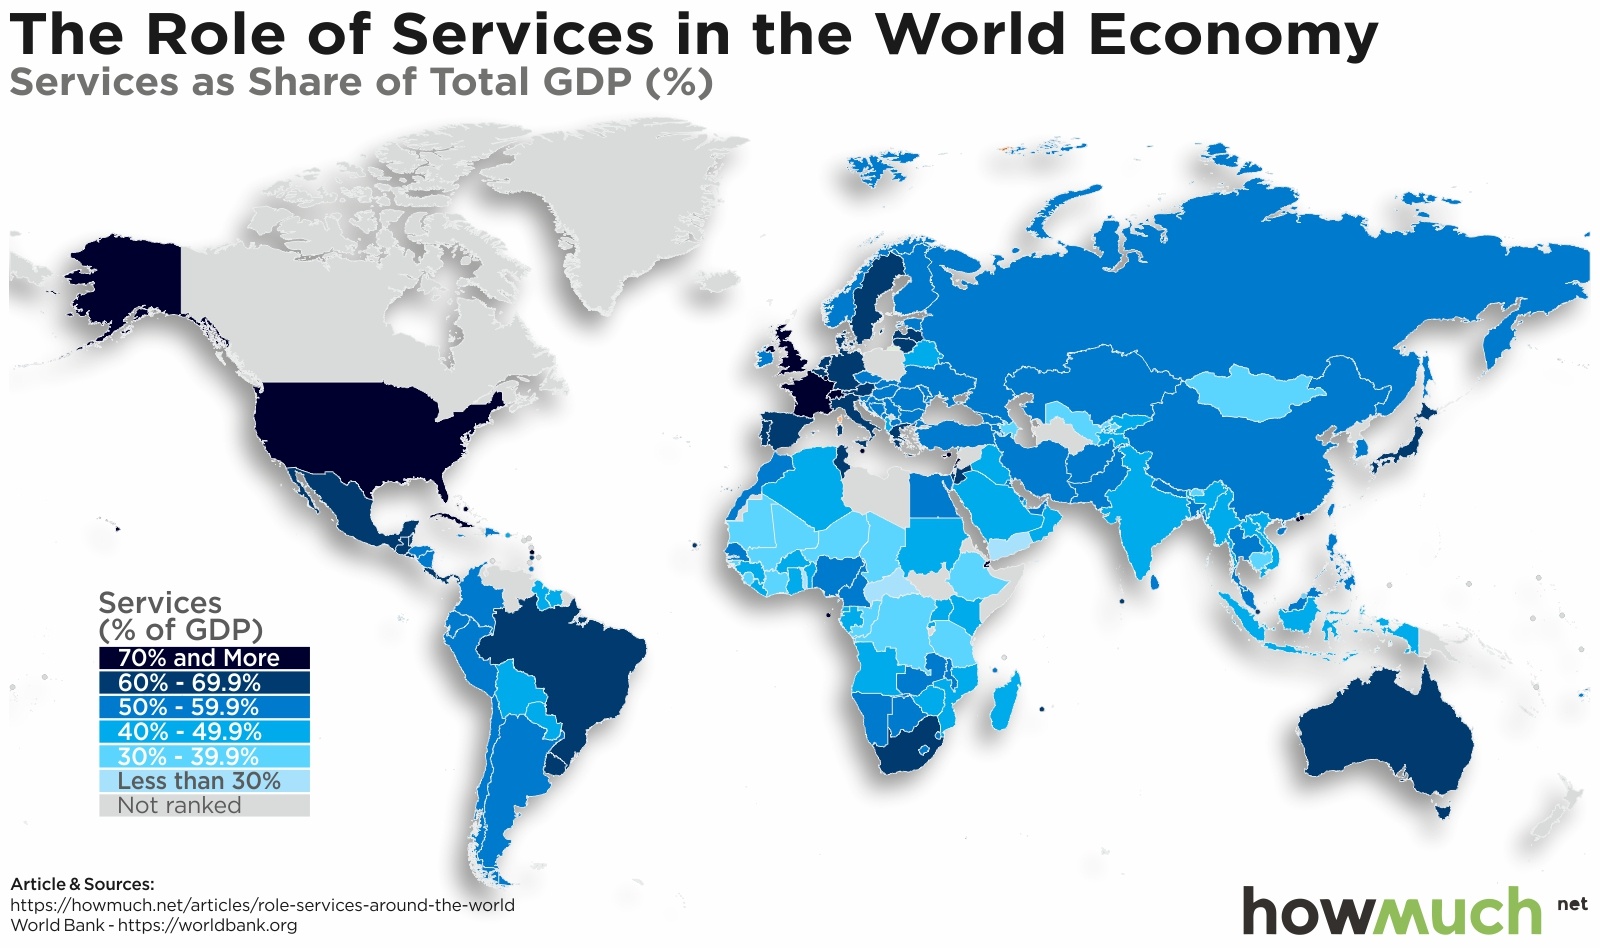
Visualizing The Importance Of Services In The World’s Economy
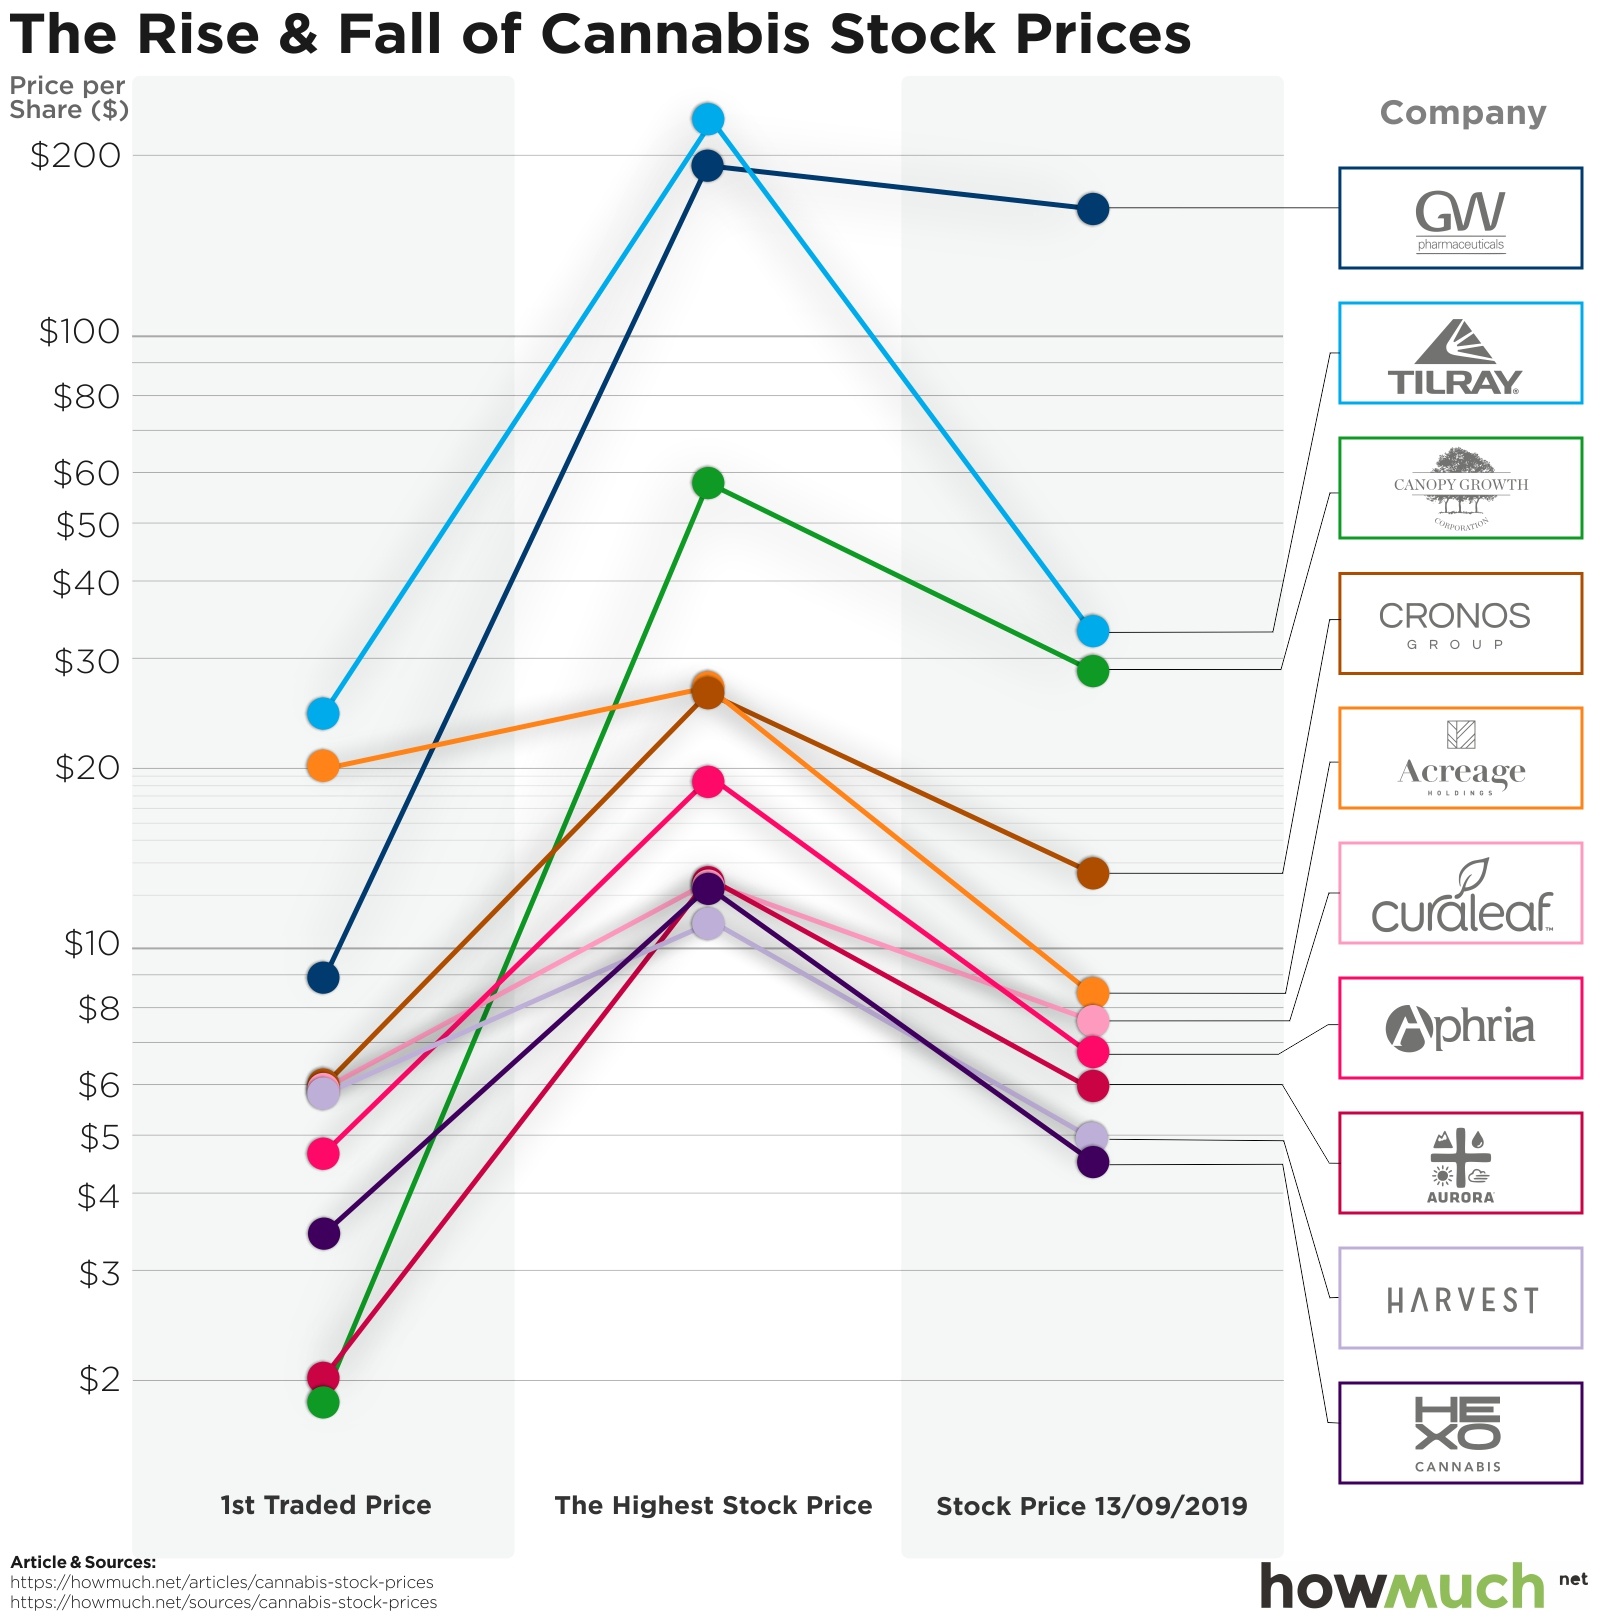
Cannabis Stock Bubbles: The Higher They Rise the Greater They Fall
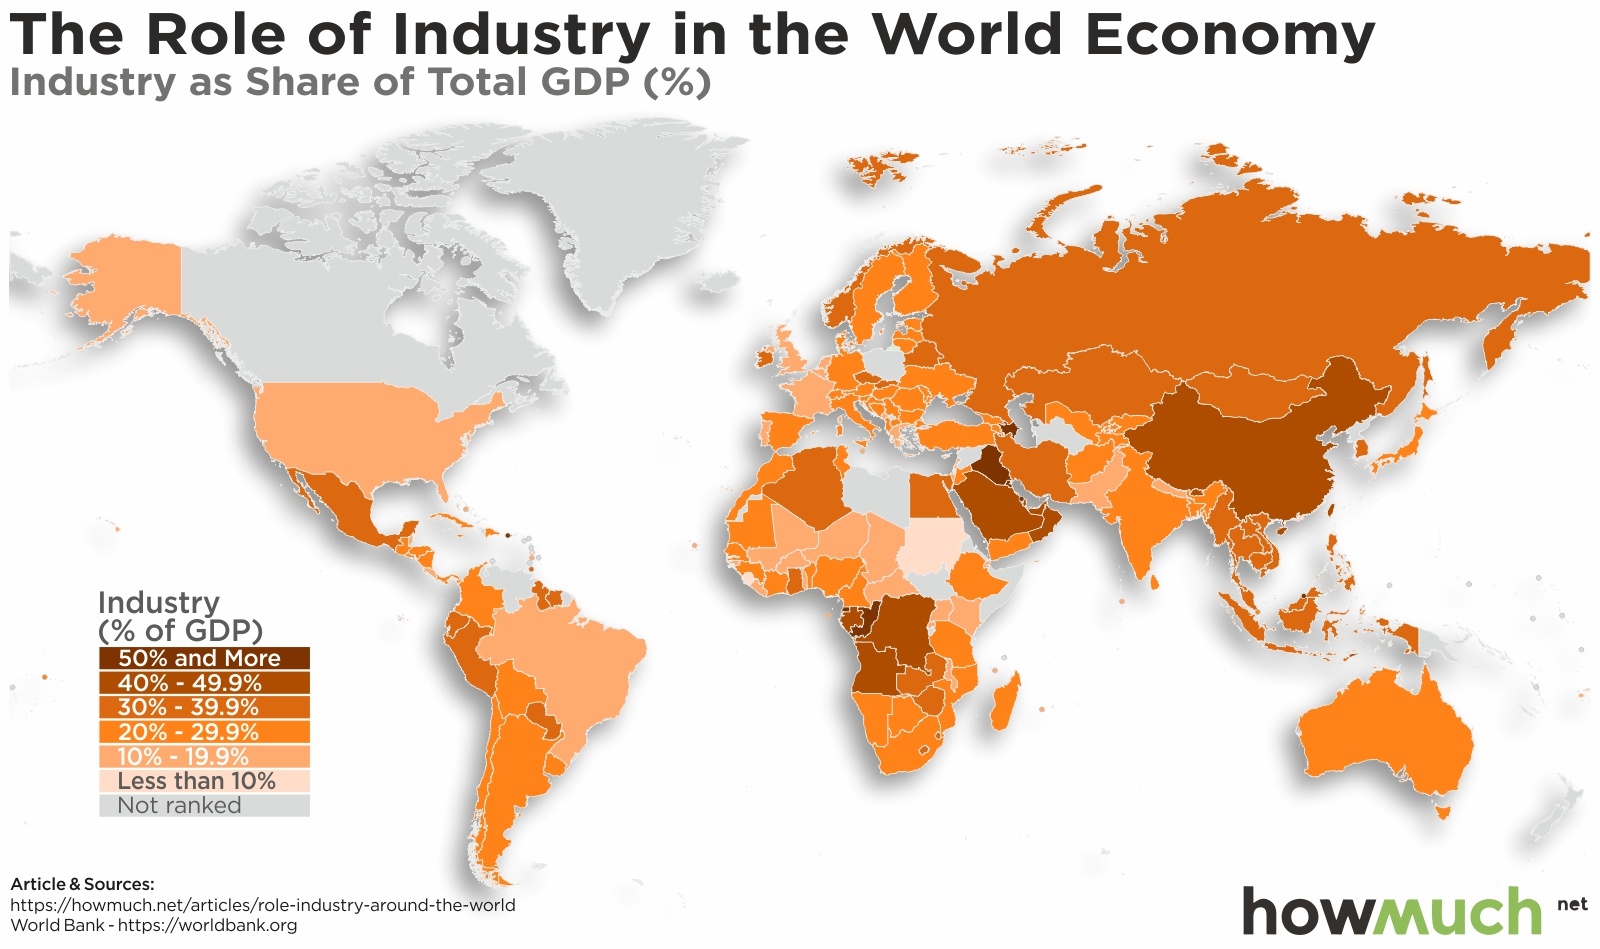
Visualizing The Importance Of Industry In The World’s Economy
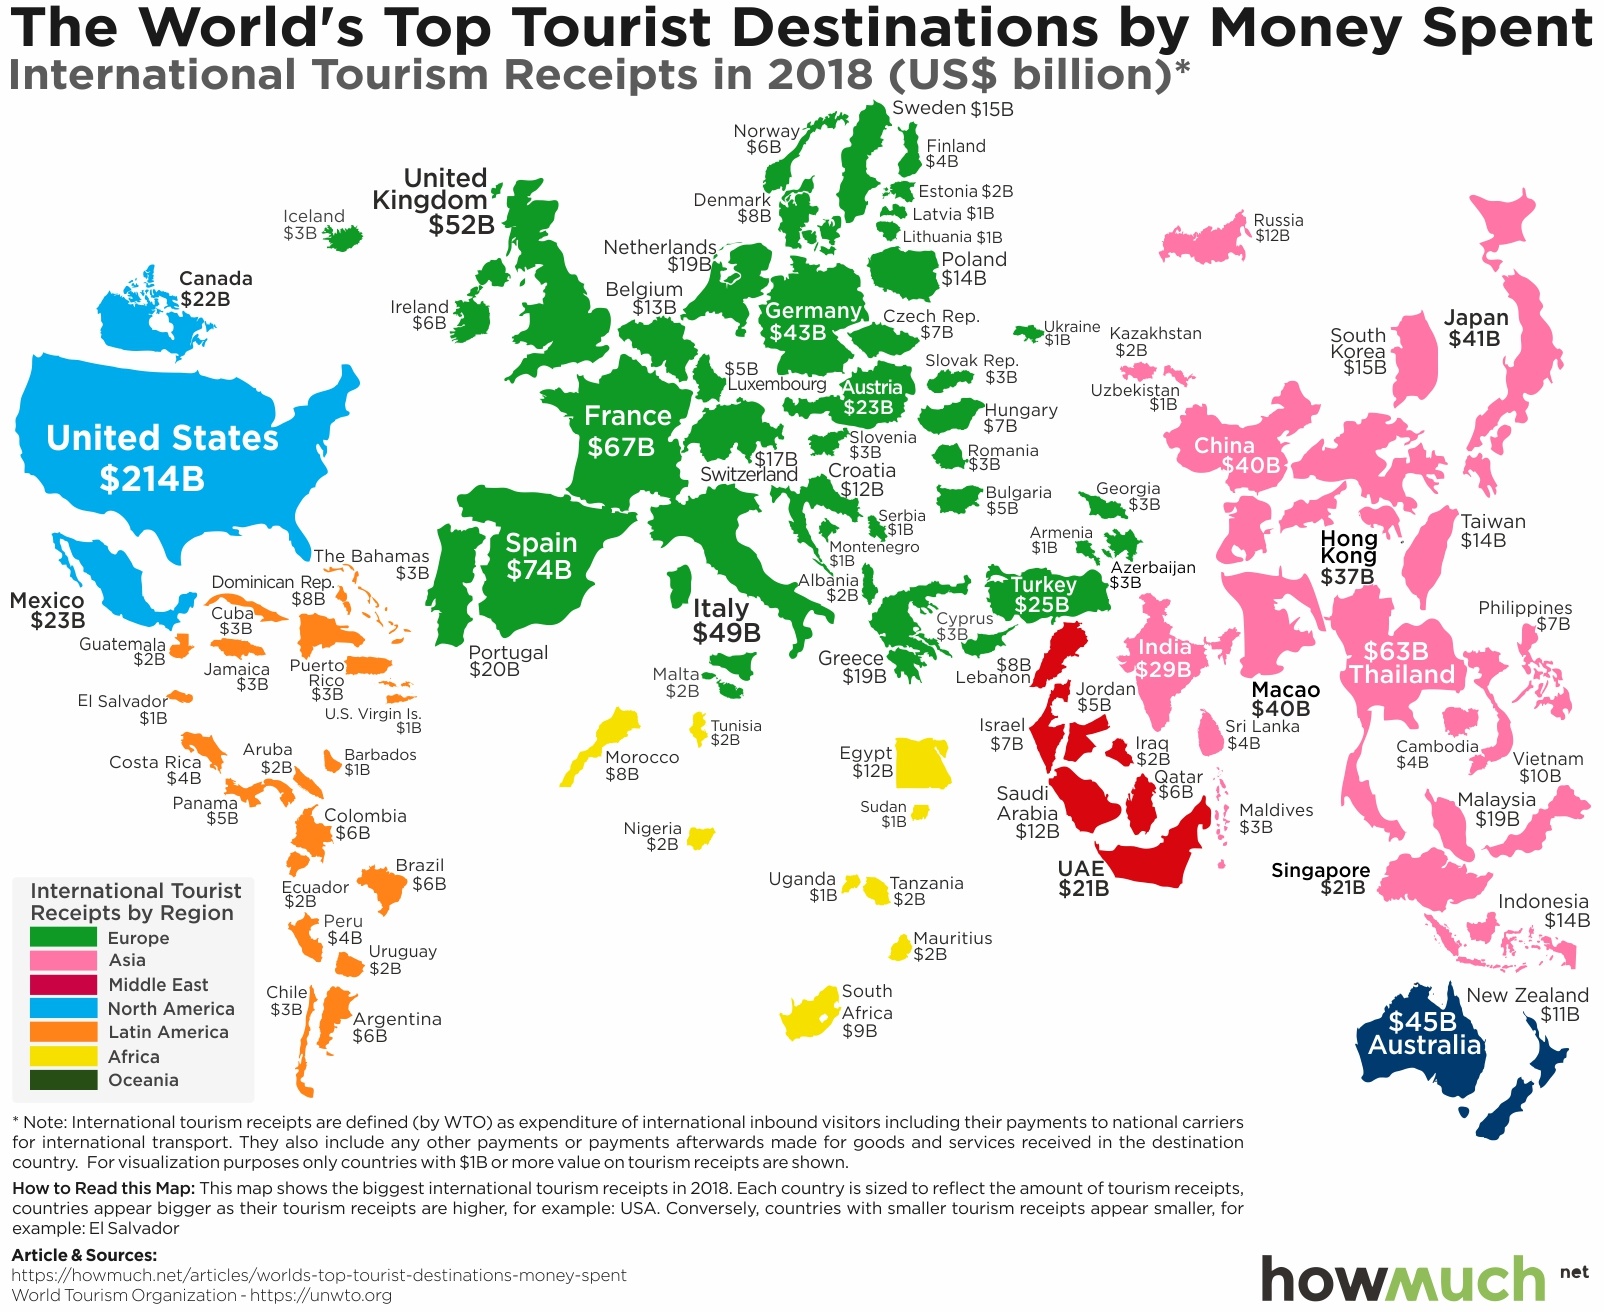
A Snapshot Of The Tourist Spending Around The Globe
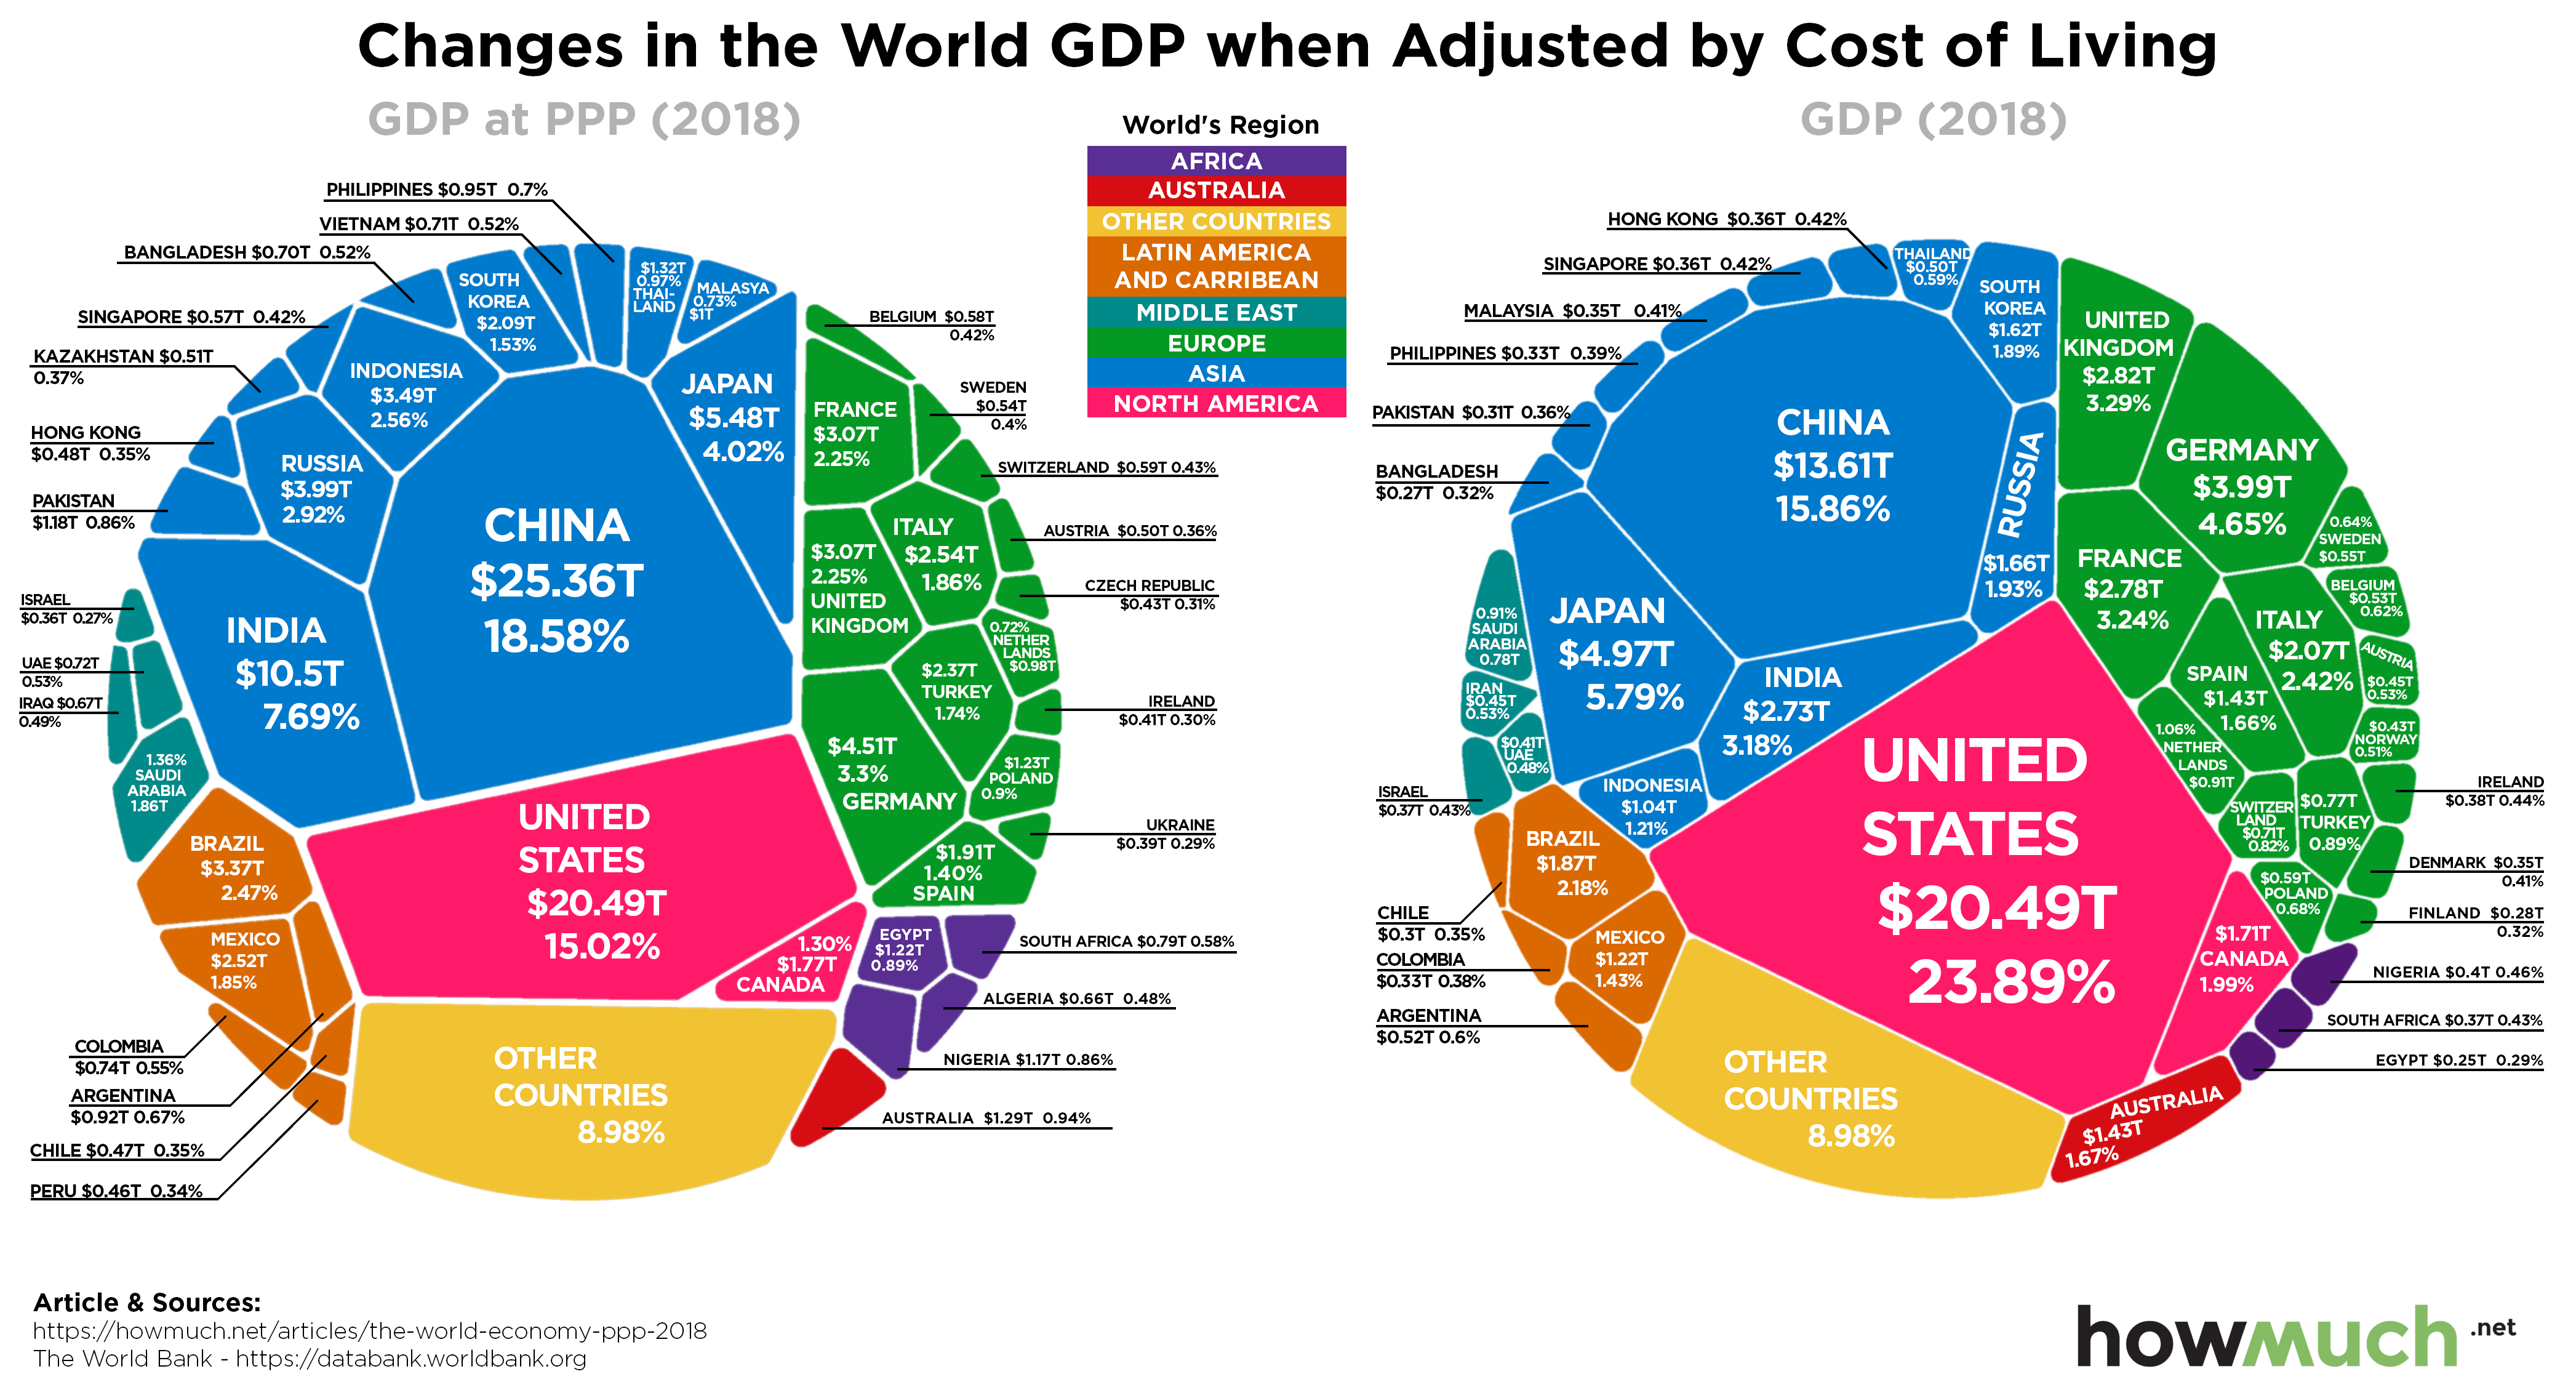
Visualizing The World Economy When Purchasing Power Is Taken Into Account