AQR’s Portfolio Solutions Group has been getting many questions from investors about what to do given the recent positive correlation between stocks and bonds. They’ve also read some pretty silly whitepapers that have come out of the industry. Co-heads Dan Villalon and Antti Ilmanen have a short (for them) and occasionally funny (again, for them) post on what they’re seeing. Given all the recent turbulence in markets, I think this topic is worth sharing. Take it away, guys:
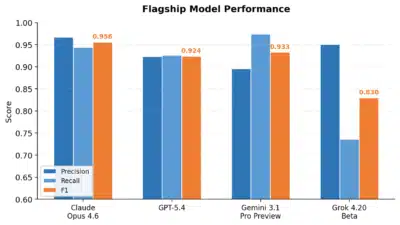
The correlation between stocks and government bonds, once fairly reliably negative 1 , turned positive 2 a few years ago (chart below). This has clear ramifications for diversification and thus for portfolio construction. Unfortunately, many investors, armed with dubious advice, are doing the opposite of what they should be.
Trailing 5-Year Correlation between Stocks and Bonds
1/1/2000 – 2/28/2026

Source: AQR, Bloomberg. Stocks are represented by the S&P 500, Bonds are represented by the Bloomberg Barclays US Treasury Index. Chart uses monthly gross data. Past performance is not a guarantee of future performance. Diversification does not eliminate the risk of experiencing investment losses.
The advice is roughly as follows:
- Bonds are now positively correlated to stocks;
- This means bonds are unable to diversify like they once could;
- And that means bonds are unable to fulfill their role in a portfolio;
- So, investors should sell bonds and add [Asset Class X].
“Asset Class X” has been many things to many managers. But too often it includes stuff that has even more equity market risk than bonds – we’ve seen (among others) privates, buffer funds, and yes, even crypto. In examples like these, investors trying to improve portfolio diversification end up making it worse.
Too Much of a Good Thing
Equity market risk dominates most portfolios. 3 Take the canonical 60/40 stock/bond portfolio, represented by 60% S&P 500 Index and 40% Bloomberg Barclays US Treasury Index. A good or bad year for stocks almost always tells you whether it’s a good or bad year for the portfolio. 4 This was true from 2000-2020 when stocks and bonds tended to be negatively correlated, and it’s true today. A simple (though far, far from perfect) way to see this is the chart below, which shows the rolling five-year correlation between the standard 60/40 portfolio and equities. Clearly, equities are the biggest driver of risk in this portfolio, regardless of whether stocks and bonds were positively or negatively correlated to equities.
The current environment is indeed different from the past in many ways. But the assertion that a positive stock-bond correlation means investor portfolios are now facing a diversification problem is incomplete: they are now, and always have been, facing a diversification problem.
Same as It Ever Was
60/40 Correlation to Stocks, 1/1/2000 – 2/28/2026 (Five-Year Rolling)

Source: AQR, Bloomberg. Stocks are represented by the S&P 500, Bonds are represented by the Bloomberg Barclays US Treasury Index. 60/40 is a monthly rebalanced portfolio with 60% in stocks and 40% in bonds. Chart uses monthly gross data. Past performance is not a guarantee of future performance. Diversification does not eliminate the risk of experiencing investment losses.
Getting Beta All the Time
Building a more robust portfolio when stocks and bonds are positively correlated means looking for asset classes and strategies that are highly diversifying to stocks (which is also the exact same goal as when stocks and bonds are negatively correlated).
While correlations can tell us something about how strongly prices move together, to get a better sense of economic magnitudes – or how much equity risk something has – beta is a better statistic to look at. 5 Beta has a very simple economic interpretation: an equity beta of 0.5 means that for every dollar allocated to the asset, you get about 50 cents of equity exposure (in addition to whatever other sources of returns that asset provides).
Let’s get to the table: over the past five years, bonds have indeed posted a positive correlation to equity markets; their equity beta of 0.2 means that every dollar allocated to bonds has effectively given an additional 20 cents of equity market exposure.
In blue we include three asset classes that have been suggested many times over the past few years as complements to a traditional stock/bond portfolio. For each of these “Asset Class X’s,” there exists “literature” that explains why it is able to improve a portfolio’s diversification in a positive stock-bond correlation environment. And for each, we can see these arguments don’t hold up.
Relationship to Equities
Five years ending 2/28/2026
| Bonds | Private Credit | Buffers | Bitcoin | |
| Correl. to the S&P 500 | 0.53 | 0.68 | 0.98 | 0.53 |
| Beta to the S&P 500 | 0.19 | 0.70 | 0.63 | 2.09 |
Source: AQR, Bloomberg, Cliffwater, Cboe. Bonds are represented by the Bloomberg Barclays US Treasury Total Return Index, Private Credit is represented by the Cliffwater BDC Index, Buffers are represented by the Cboe S&P 500 Buffer Protect Index Balanced Series. We show a Treasury index as a proxy for bonds, but results for the Barclays US Agg are similar. Similarly, results for the S&P BDC Index are similar to those for Cliffwater. Past performance is not a guarantee of future performance. Diversification does not eliminate the risk of experiencing investment losses.
Private Credit:
It’s hard to argue with the performance that private credit has posted over the past decade. 6 But it’s easy to argue that these returns come with more equity-related risk than the returns of government bonds and other high-quality bonds. 7
Private credit often understates its true economic risk and volatility, thanks to how loans are valued, and thus how returns are reported. 8 One way to get a more market-based estimate of these risks is to look at the performance of lending-oriented exchange-traded Business Development Companies (BDCs), which we use in the table above.
Over the past five years, these private credit proxies have delivered returns with more than three times as much equity risk as Treasuries. If you like the asset class, fine; but if you’re looking for new sources of diversification, this ain’t it. 9
Buffer Funds:
Newer to the scene are buffer funds, 10 which use options to deliver a “pre-defined outcome” based on the unknowable future performance of an equity index. That last phrase right there should give away the punchline: returns based on the performance of an equity index are going to have some equity risk in them.
Whereas private credit can at least claim to be bond-like (both being forms of debt); most buffer funds are tied to the performance of stock markets, so the claim that they can be a bond replacement starts on shaky ground.
Proponents of “buffers-as-bond-replacements” often argue that, like bonds, buffers offer “known” payoffs. 11 They also point to years like 2022, where bonds were unable to offset losses in equities. The fact that inflation shocks tend to hurt both stocks and bonds is not new. It’s also not a reason to get rid of bonds for more stocks. Concerns about inflation risk mean that arguably you should add some inflation-sensitive assets to a portfolio, not more equities with options added on top. 12
(Oh, and as a group, consistent with simple logic and data, buffer funds offer less return than the equivalent risk portfolio of equities and cash. How they can argue “oh, bonds are less-diversifying-than-normal to equities, so what you need is equities themselves plus cash minus some non-trivial number,” is beyond us.)
Bottom-line: an equity beta three times that of bonds isn’t a great contender for solving a diversification problem.
Crypto:
For the ultimate “hold my beer” asset, there’s crypto. What was once a fringe and diversifying investment a decade ago is now an asset class has been creeping into large institutional portfolios (and has been increasingly tied to the performance of risky markets, like stocks).
Crypto allocations are often made under the guise of diversification. The justification is vibes, cloaked in a word salad of technical-sounding nonsense. If it were true that crypto were independent and free of the conventional economic system, you’d expect to see some low correlations to equities.
Over the past five years, the correlation between Bitcoin and stocks has been about as high as the feared correlation between stocks and bonds – but with a very important difference: due to Bitcoin’s super high volatility, its equity beta is a 2.0. Investors moving from bonds to Bitcoin for diversification reasons are getting 10x the equity risk for every dollar they move. 13
Actual Diversifiers Do Exist
Long/short alternative strategies have been around a long time (their live track records extend longer than our dubious bond replacements, anyway). Despite AQR’s complaining that many long/short alternatives aren’t as diversifying as they maybe should be, there are a few categories that really stand out for equity risk diversification. Two are Equity Market Neutral (you’d hope so, given the name…) and Trend-Following (which we’ll simply call “Trend” here).
As with any active strategy, manager selection matters (yes, we have a dog in this fight!). But for this post, we’ll ignore that and focus on the index level by adding two hedge fund indexes to our previous table: Equity Market Neutral and Trend. 14
Relationship to Equities
Five years ending 2/28/2026
| Bonds | Private Credit | Buffers | Bitcoin | Equity Market Neutral | Trend | |
| Correl. to the S&P 500 | 0.53 | 0.68 | 0.98 | 0.53 | 0.18 | -0.28 |
| Beta to the S&P 500 | 0.19 | 0.70 | 0.63 | 2.09 | 0.02 | -0.22 |
Source: AQR, Bloomberg, Cliffwater, Cboe, SocGen, HFRI. Bonds are represented by the Bloomberg Barclays US Treasury Total Return Index, Private Credit is represented by the Cliffwater BDC Index, Buffers are represented by the Cboe S&P 500 Buffer Protect Index Balanced Series, Equity Market Neutral is represented by the HFRI EH: Equity Market Neutral Index, Trend is represented by the SocGen Trend Index. Past performance is not a guarantee of future performance. Diversification does not eliminate the risk of experiencing investment losses.
Equity Market Neutral:
Over the past five years (again, not as long as we like to look at, but our focus is the recent “positive stock-bond correlation” period), Equity Market Neutral managers in aggregate delivered on their objective of diversifying returns – delivering an equity beta that rounds to 0.0. 15
Trend:
Trend has been researched and tested over a long time period and using a broad array of liquid assets (even including some alternative ones). It’s also been shown to be helpful when most needed: when equities have protracted drawdowns – something we’ve written about again and again.
It’s probably not surprising then that Trend’s equity beta has been so low (maybe surprising that it’s actually been slightly negative over this period). 16 Of course there will be variation from manager to manager, but it’s striking that even at the industry level, true diversification seems part and parcel of the strategy.
Before You Ask…
Our focus here is on diversification, but of course a diversifier with paltry returns is a pyrrhic victory for risk-adjusted returns. So let’s add a few more statistics to our table: returns, volatility and “alpha” relative to stocks over the recent 5 years (yet again a shorter period than we would ever want to evaluate a strategy, but this blog is focused only on the recent environment).
Each of our first three candidates (Private Credit, Buffers, and Bitcoin) all had attractive returns over the period – certainly higher than that of Bonds. But most (or more than most!) of their returns can be explained by exposure to stock market risk. Take the example of Private Credit (again using the BDCs as a proxy that’s actually marked to market): its 7.3% annual average return over the past five years looks compelling standalone, but when you account for the fact that it’s also delivered a 0.63 beta to equity markets, you end up with a -3.8% annual alpha (a large but, granted, statistically insignificant number). Bitcoin’s 25% annual return similarly falls to a bit less than zero when you account for the fact that every dollar in it gives you 2 dollars’ worth of exposure to equity markets.
How do the long/short alternative strategies look? Over this short period, pretty darn good: both indexes delivered substantially higher returns than bonds, and thanks to those returns having low (or in the case of trend, negative) betas to equity markets, each had large annual alphas to equities. 17
Relationship to Equities + Performance
Five years ending 2/28/2026
| Bonds | Private Credit | Buffers | Bitcoin | Equity Market Neutral | Trend | |
| Correl. to the S&P 500 | 0.53 | 0.68 | 0.98 | 0.53 | 0.18 | -0.28 |
| Beta to the S&P 500 | 0.19 | 0.70 | 0.63 | 2.09 | 0.02 | -0.22 |
| Average Return | 0.1% | 7.3% | 10.9% | 25.5% | 7.1% | 8.6% |
| Volatility | 5.6% | 15.3% | 9.7% | 60.4% | 2.3% | 11.9% |
| Alpha | -5.4% | -3.8% | 0.7% | -1.3% | 3.6% | 7.8% |
| T-statistic | -2.5 | -0.7 | 0.7 | -0.1 | 3.6 | 1.5 |
Source: AQR, Bloomberg, Cliffwater, Cboe, SocGen, HFRI. Bonds are represented by the Bloomberg Barclays US Treasury Total Return Index, Private Credit is represented by the Cliffwater BDC Index, Buffers are represented by the Cboe S&P 500 Buffer Protect Index Balanced Series, Equity Market Neutral is represented by the HFRI EH: Equity Market Neutral Index, Trend is represented by the SocGen Trend Index. Past performance is not a guarantee of future performance. Diversification does not eliminate the risk of experiencing investment losses.
Conclusion
This post is not about the standalone attractiveness of any of these asset classes. Rather, our contention is that investors who believe that bonds are impaired because of correlation should apply a high diversification bar for the next asset they bring into their portfolio. Furthermore, three of the most commonly suggested alternatives, with proponents who actively make the “bonds don’t diversify you anymore” argument, each come with far more equity risk than do bonds. These proponents really should stop making this very bad argument. But they won’t.
Oh, and don’t get us wrong: we generally like bonds as part of an overall portfolio, even with recently higher correlations. 18 , 19 There’s little else out there that performs as consistently-well during recessions and related environments of falling growth. But if you want to sell bonds and improve the diversification of your portfolio, the leading candidates should be things that are diversifying to equity risk (and ideally to bonds, too, though far less important as, again, bonds don’t impact traditional portfolios nearly as much as equities do).
Article by Cliff Asness, Daniel Villalon, and Antti Ilmanen – AQR