

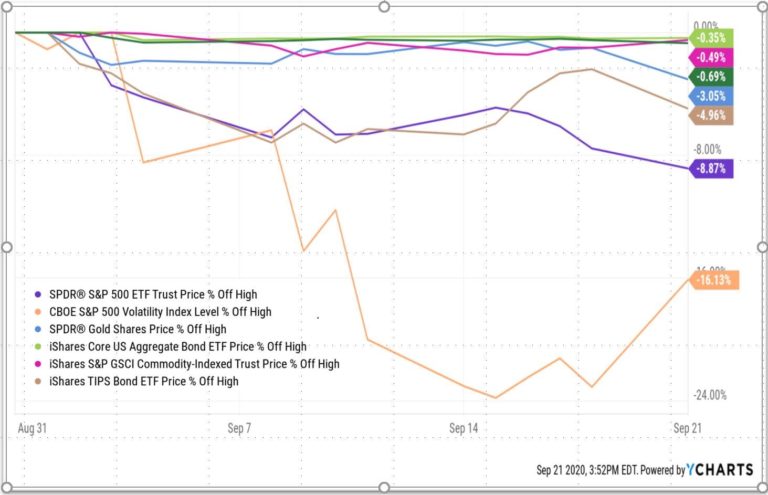
September has been rather nasty (so far) not just in equities, but across the various asset classes purporting to provide diversification from such down turns. After today’s sell off, the S&P 500 is down around -9% for the month. Gold is off about -3%, Commodities down about -5%, and bonds and TIPS are likewise slightly in the red. It’s the 2020 market version of the classic wedding dance tune by Martha & The Vendellas:
Q2 2020 hedge fund letters, conferences and more

But what’s got some all confused and really feeling there is nowhere to run or hide is that the VIX is down -16% for the month…in spite of all those losses across asset classes. Just think about that for a second. The VIX…. You know, the thing that would usually have spiked 20% or more in past -5% to -9% sell offs – has fallen double digits since in a few short weeks.

What’s happening here?
Well. First and foremost. These are markets. They are noisy. Meaning non-correlated assets can at times move in the same direction. If they didn’t do that from time to time, they would be perfectly negatively correlated. There’s no free lunch where the diversifier always delivers no matter the speed or size of the down move. No two moves are alike, and no two reactions by other assets to those moves will be alike. Sometimes bonds will sell off in tandem with equities, sometimes they will act as a flight to safety. Sometime Gold will protect – sometimes you’ll wonder if it is a centuries old idea that’s past its prime.
Secondly. Remember we were in the 80s in the VIX six months ago, the 40s 3 months ago, and in the 30s earlier this month. A VIX of 30 means option prices are reflecting 30% annualized volatility, which equates to roughly 2% daily moves and about 8.6% monthly moves. That’s a high bar to hit in terms of volatility. Meaning, the VIX can have its cake and eat it too, so to speak. It can move 1.5% per day and fall 8.5%, and STILL be lower than what was expected from a 30 VIX, causing the VIX to fall even though the market also fell. For volatility to increase from a 30 VIX (not to mention an 80!), the market has to move more than the volatility implied in that reading. That seems rather intuitive, but is surprisingly easy to forget for most investors.
So, part of what’s happening is that we are returning to a more normal relationship between expected (or implied, as they call it in the biz) volatility and realized volatility. When the implied volatility is well above the realized volatility, we usually think one of two things will happen – realized volatility will increase to match the implied, or implied will fall to come down in line with the realized. But a third option exists, where both happen. Where implied falls AND realized rises. That, more than anything, is what has been happening in September, so far. We’ll let others debate as to the why it is coming back in line now, versus all the time April through August it had to do this, but there’s no debating the actual stats showing spot down/vol down.
For those looking for convexity in their long volatility trades and a more “normal” relationship between VIX and SPY, we sort of needed a period like this to bring them back in line a bit. It’s a perverse twist on the calm before the storm metaphor, being a sort of storm before the storm (or probably more correctly, the storm before the calm before the storm).
Article by RCM Alternatives


